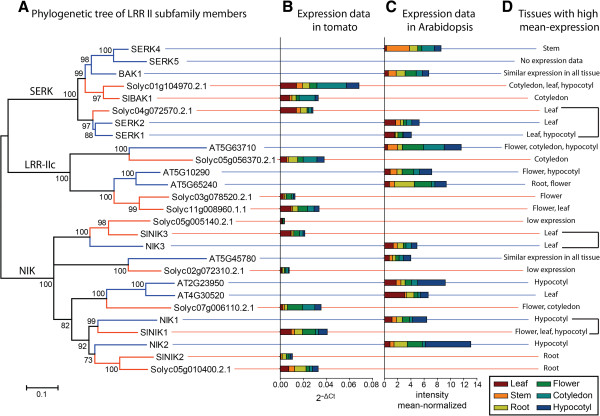
Figure 3.
Phylogenetic and expression analysis of LRRII subfamily members. (A) Phylogenetic tree reconstructed by the maximum likelihood method (JTT+G+I, bootstrap replicates = 1000) of the LRRII subfamily. Members of this subfamily can be separated in three well-supported clades, referred to here as SERK, NIK and LRRIIc clades. Expression analysis of LRRII subfamily members in (B) tomato and (C) Arabidopsis in different plant tissues. The expression data of tomato and Arabidopsis members were obtained by qRT-PCR and from normalized data from the AtGenExpress database [55], respectively. No expression data were obtained for AtSERK5 (At2g13800). (D) Tissues with high mean-expression are summarized for each gene. Orthologous genes that had similar expression profiles are delimited by brackets.

