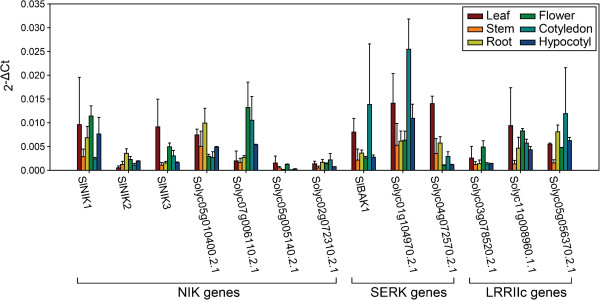
Figure 6.

Expression analyses of tomato members of the LRRII subfamily in various plant organs by qRT-PCR. Expression of each gene was quantified using SlAPT1 as an endogenous control. Bars represent the mean expression from three biological samples and two replicates, except for the flower and hypocotyl samples, for which two biological samples and two replicates were used. Error bars represent a confidence interval of 95%.
