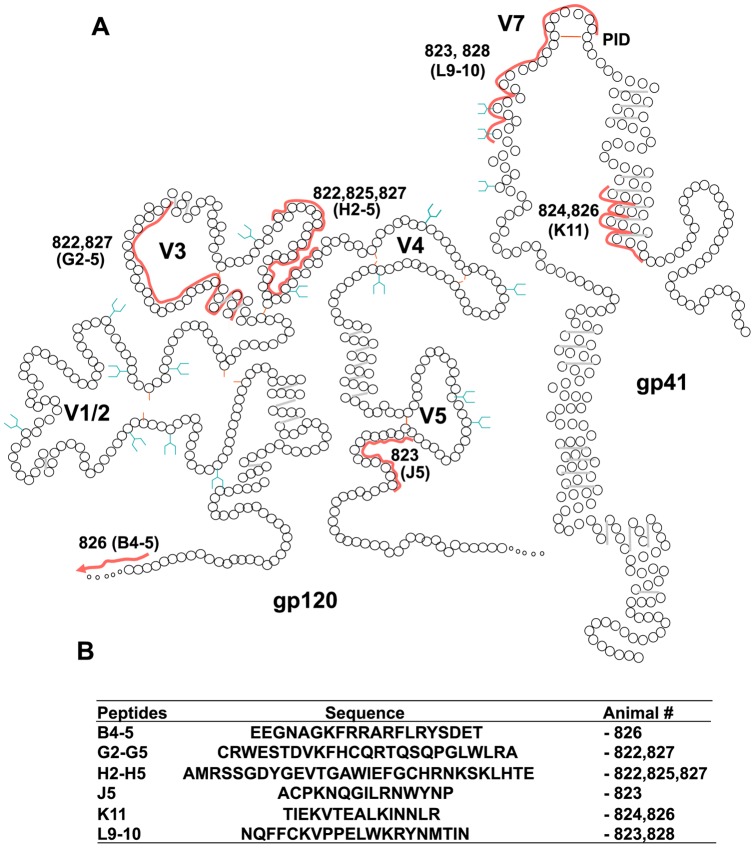
Figure 8. (A) Location of T cell epitopes identified by ELISpot on schematic representations of FIV gp120 and gp41.
Each circle represents a single amino acid, regions constituting T cell epitopes are marked by a red line with responding cat number alongside and peptide names in parenthesis. Predicted sites for N-linked glycosylation are in blue. (B) Amino acid sequences of T cell epitopes covered by the ELISpot peptides and the animals that responded.

