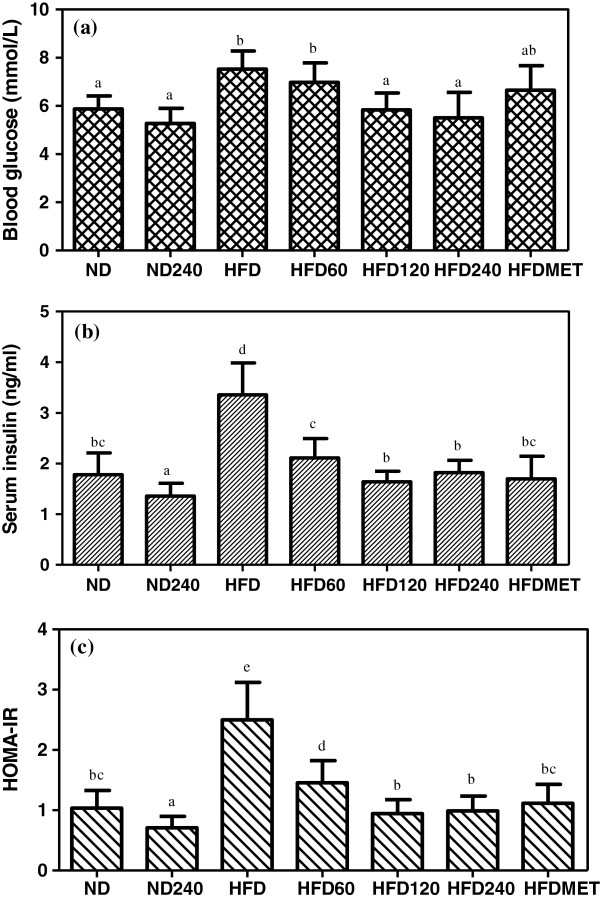
Figure 2.
Effects of GE on (a) fasting blood glucose concentrations, (b) serum insulin levels and (c) HOMA-IR value of C57BL/6J mice fed a high-fat diet or normal diet. GE concentrations were 60, 120, 240 mg/kg/day. Metformin (MET) was used as positive control. Values expressed are means ± S.D of triplicate measurements (n=6 per group). Means with different alphabets in different bar (a-e) are significantly different (p<0.05).

