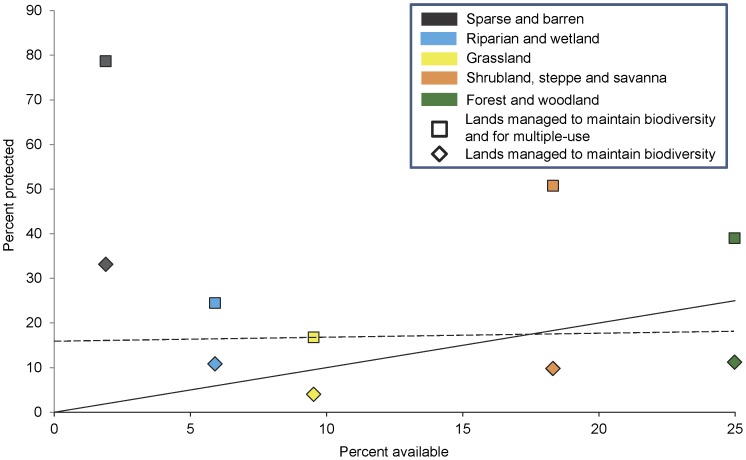
Figure 2. Percent protected and available for each Level I land cover group by protection status.
Lands managed to maintain biodiversity (diamonds) are shown relative to lands managed to maintain biodiversity and for multiple-use (squares). See Table 1 for protection status descriptions. A comparison index line is shown, which indicates a 1∶1 relation between percent availability and percent protected [61]. A value below the 1∶1 line represents a Level I land cover group under-represented in the protected areas network, a value above represents a Level I land cover group well represented in the protected areas network, while a value on the line indicates a Level I land cover group available and protected equally [61]. For example, grassland, a Level I land cover group, has about 4% of its area managed to maintain biodiversity, but that increased to about 17% when lands managed for multiple-use were included [23], [24]. A dashed line representing the 17% Aichi Biodiversity Target of the Convention on Biological Diversity is shown [36].

