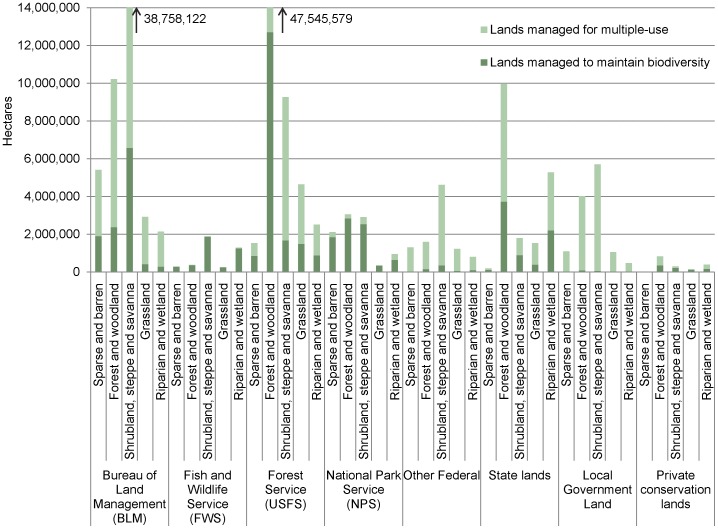
Figure 5. Area (ha) of Level I land cover groups by ownership and protection status.
Ownership includes federal, state, and local governments as well as private conservation lands. See Table 1 for protection status descriptions. These values were for the continental US. Both BLM and USFS have areas of Level I land cover groups that fall outside the scale on this graph [23], [24]. Values for those Level I land cover groups are shown.

