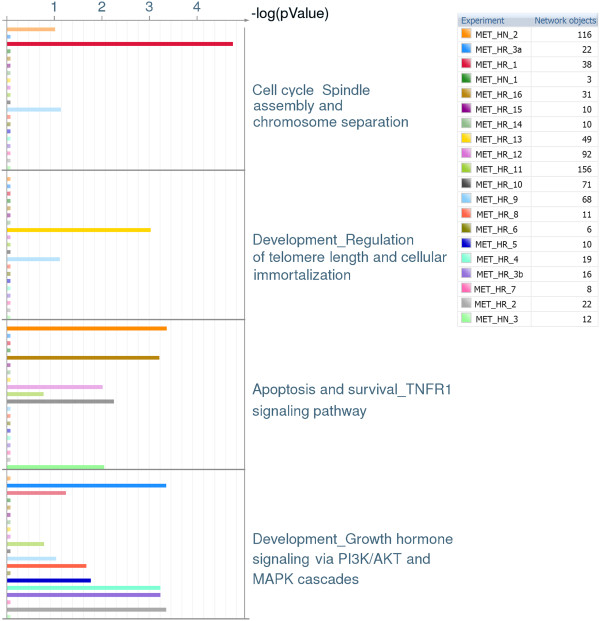
Figure 4.
Details of outlier pathway analysis highlighting the differences between pathways significantly disrupted in individual samples. In the first two pathways, only a single sample shows significant pathway enrichment, whereas the last two pathways are more-generally affected in 15% and 30% of metastatic samples respectively.

