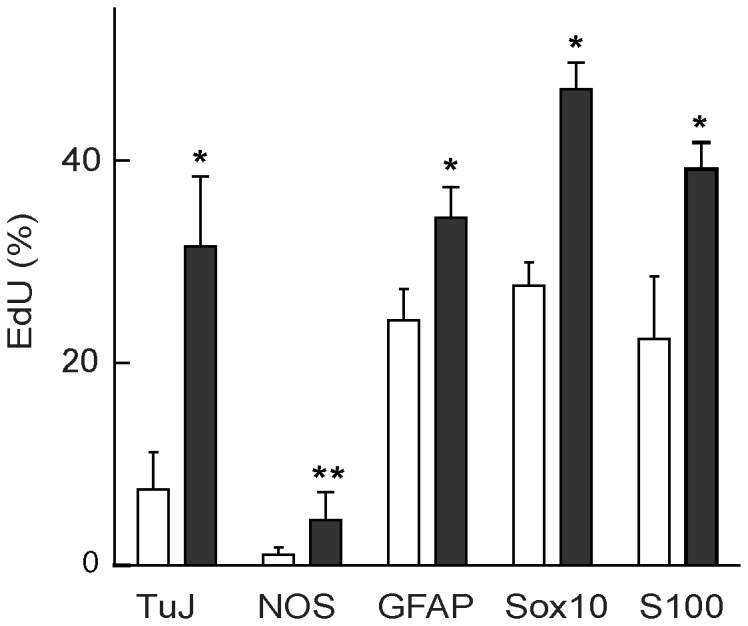
Figure 4. Analysis of proliferation of mouse neurosphere cells expressing neuronal and glial markers.

Neurosphere cells were dissociated and allowed to attach to chamber slides immediately after a 1 h pulse of 10 µM EdU (open columns), or after a 96 h chase in the absence of EdU (closed columns). The vertical axis shows the percentage of cells positive for specific phenotypes that had also incorporated EdU. Error bars represent SEM (n = 3 separate experiments). A two-tailed t-test was performed for differences between before and after chase (open and closed columns) for each marker. * p<0.05; ** p<0.075.
