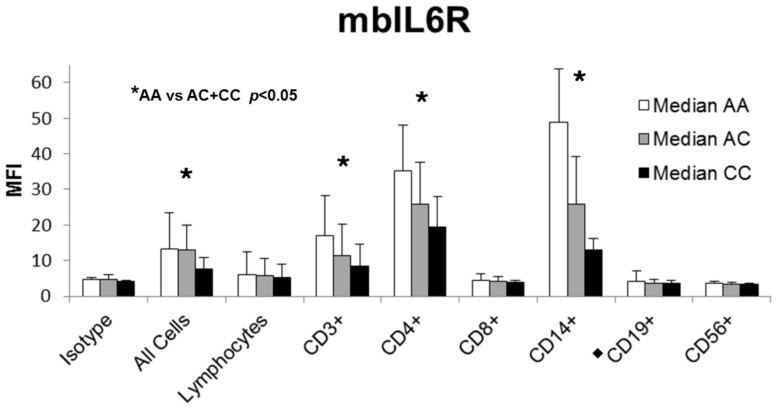
Figure 2. mbIL6R levels.
Levels of mbIL6R for CD patients (n = 58) and HD (n = 50) were measured by flow cytometry. Subjects who are homozygous for the major allele exhibit the highest levels of mbIL6R (white). Levels are decreased at the cell surface of heterozygous subjects (grey) and lowest on minor allele-homozygous subjects (black). Reductions were significant on a subset of T cells and monocytes. CD19 data is omitted from 5 patients who received rituximab (black diamond). MFI: median fluorescence intensity.

