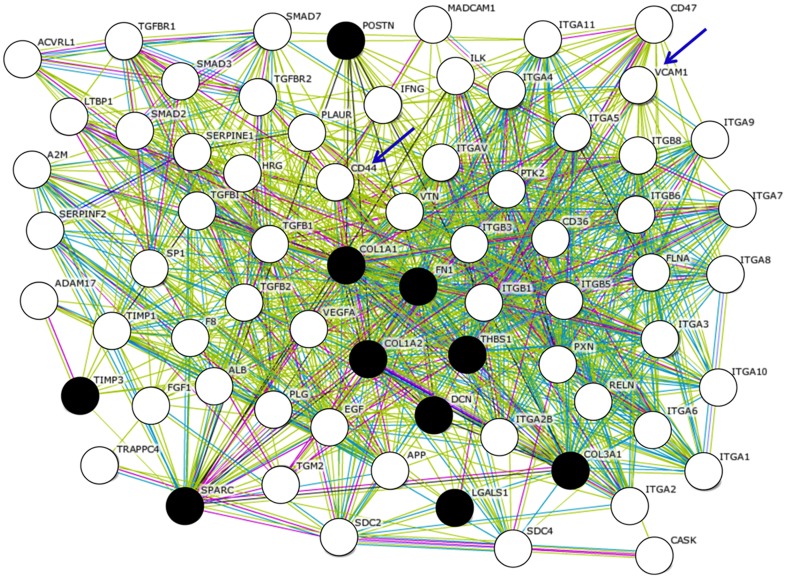
Figure 2. Molecular networks associated with the genes expressed in ERMs associated with PVR (PVR-ERM) are shown.
Gene symbols of 10 cell adhesion-related genes (FN1, COL1A2, COL1A1, COL3A1, TIMP3, LGALS1, THBS1, DCN, POSTN, SPARC) from the PVR-ERM cDNA library were queried against the STRING database, and the predicted interactions for genes/proteins were obtained. Filled black circles represent the submitted 10 genes/proteins from the PVR-ERM cDNA library, and the white circles represent potentially expressed 60 genes in PVR-ERMs that are extracted in Silico. Of these, CD44 and VCAM-1 were examine by ELISA and are shown by arrows. The gene names are shown next to the circles. The edges connecting two circles represent the predicted functional associations. An edge is drawn with up to 7 differently colored lines. These lines represent the presence of the seven types of evidence used in predicting the associations. A red line indicates the presence of fusion evidence; a green line-neighborhood evidence; a blue line–co-occurrence evidence; a purple line-experimental evidence; a yellow line-textmining evidence; a light blue line-database evidence; and a black line–co-expression evidence.

