
Figure 4. Knockdown of P-gp measured at mRNA level by qRT-PCR.
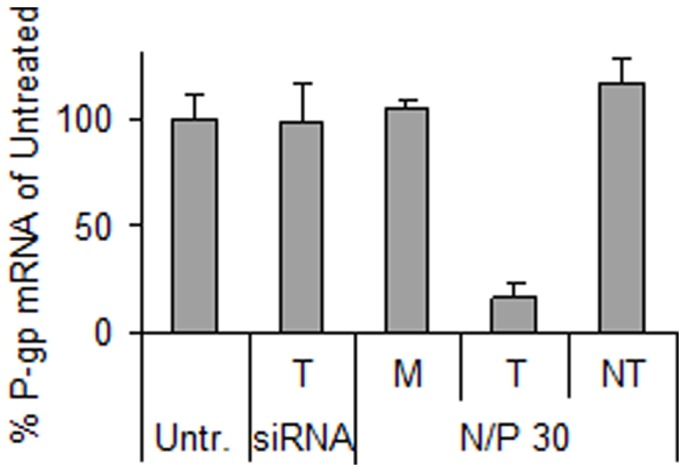
The cells were transfected with only chitosan (mock, M) or nanoparticles having N/P 30 and P-gp targeting (T) or non-targeting (NT) siRNA concentrations of 100 nM. Cells were also treated with naked siRNA (siRNA). Data represents mean values ± s.d., n = 3.