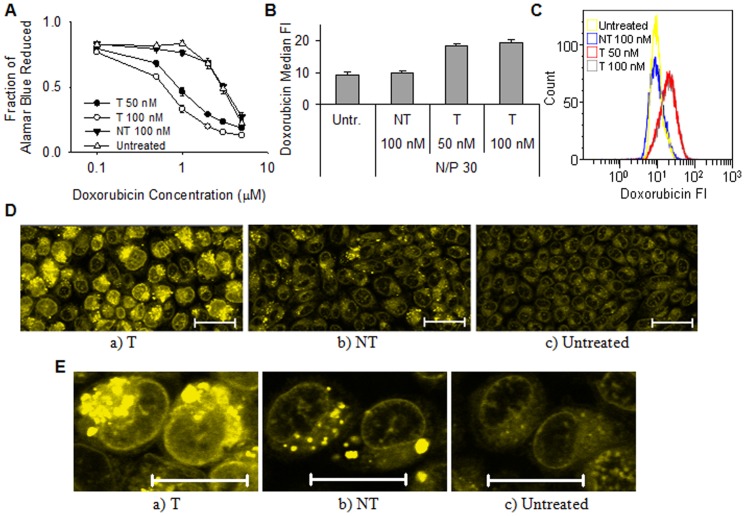
Figure 6. The effect of P-gp knockdown on doxorubicin efficacy and delivery.
A) Metabolic activity of cells after two days of incubation with doxorubicin. The cells were transfected with nanoparticles having N/P 30 and P-gp targeting (T) or non-targeting (NT) siRNA concentrations of 50 or 100 nM. Data represents mean values ± s.d., n = 4. B) Intracellular uptake and accumulation of doxorubicin expressed as the median FI of the cells. The cells were transfected with nanoparticles having N/P 30 and T or NT siRNA concentrations of 100 nM. Data represents mean values ± s.d., n = 3. C) Representative histograms of doxorubicin fluorescence from flow cytometry analysis of untreated or transfected cells. D) Representative CLSM images after transfection with a) T or b) NT siRNA or c) untreated cells. E) Enlarged images of RBE4 nuclei. The cells were transfected with nanoparticles having N/P 30 and a siRNA concentration of 100 nM. Doxorubicin fluorescence is indicated with the green color. The bar size is 20 µm.

