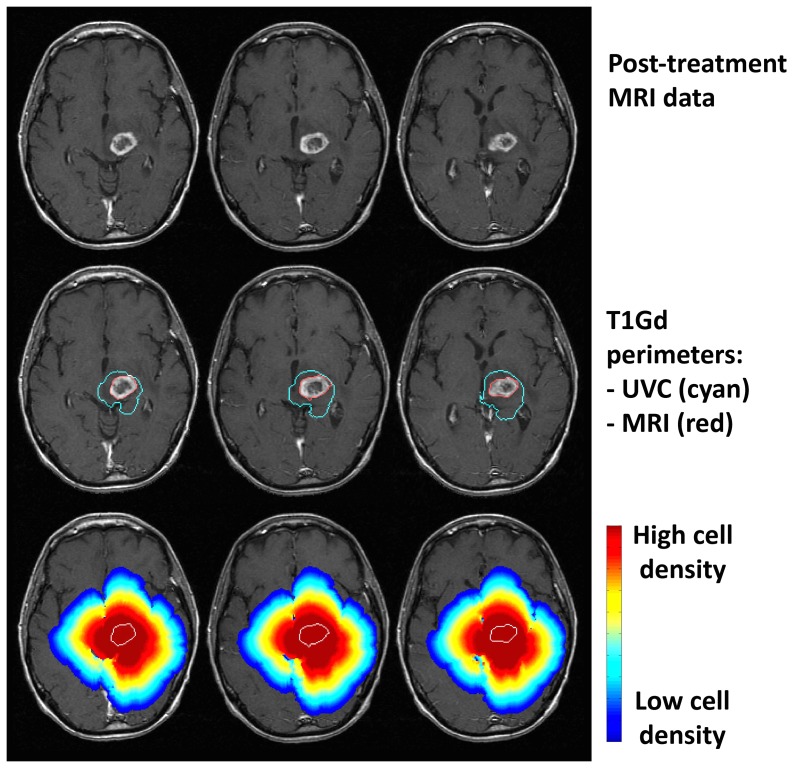
Figure 2. Comparisons between T1Gd MRI data and untreated virtual control (UVC) prediction at post-treatment time point.
Patient was 58 years old and underwent biopsy followed by conformal radiation therapy with concurrent temozolomide chemotherapy. Top row: MRI data. Middle row: Actual tumor perimeter (red) with superimposed UVC-predicted tumor perimeter (cyan). Bottom row: full distribution of UVC cell densities showing invasion peripheral to abnormality. Outermost blue cell density profile represents a very low, but non-zero, threshold. Perimeter of actual tumor outlined in white.

