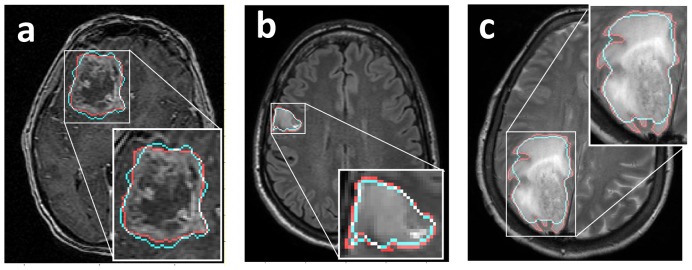
Figure 3. Spatial comparisons between baseline pre-treatment MRI (red outline) and simulation results (cyan outline) seeded with our initial condition. a: large tumor on T1Gd MRI.

b: smaller tumor on FLAIR MRI. c: Highly anisotropic tumor growth on T2-weighted MRI. Our simulations produce tight spatial matches to a range of tumors (a and b), but decrease in accuracy for tumors with high anisotropy (c).
