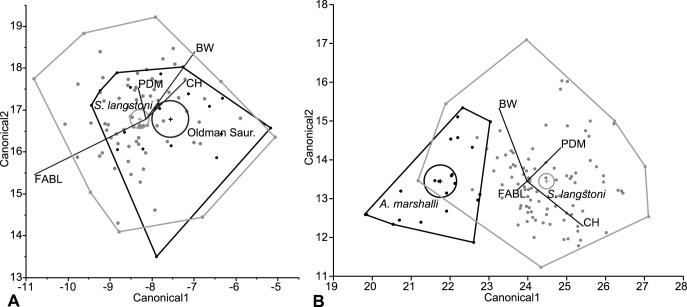
Figure 4. Example discriminant function analysis (DFA) canonical plots.
A, Saurornitholoestes langstoni (Dinosaur Park; gray) vs. Oldman Saurornitholestinae (black), no discrimination of categories (hit ratio = 69.44%, p = 0.1363). B, S. langstoni (Dinosaur Park; gray) vs. Atrociraptor marshalli (Horseshoe Canyon; black), discrimination of categories (hit ratio = 94.215%, p<0.0001). Centroids (with 95% confidence interval) and associated convex hulls are labelled. Canonical axes 1 and 2 indicate the first two axes of maximum discrimination in the dataset.

