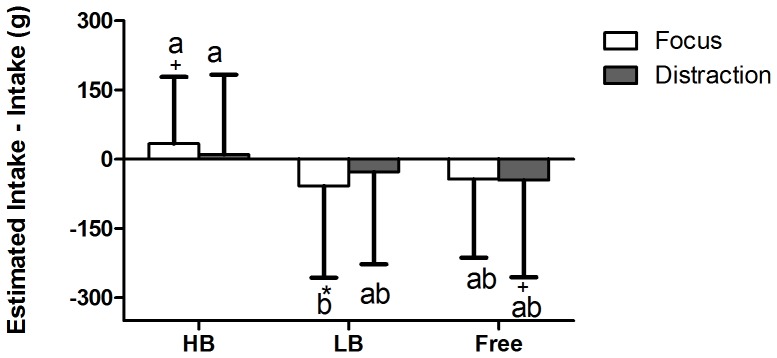
Figure 3. Differences between the estimated amount consumed and the ad libitum intakes (means+SD).

The difference (estimated intake minus intake) was affected by sip size (P<0.001), but not by distraction (P = 0.72), and there was no interaction (P = 0.34). * = significant difference between estimated intake and intake (P<0.05., + = trend between estimated intake and intake (P<0.10). Values on bars with different superscript letters are significantly different (P<0.05).
