
Fig. 2.
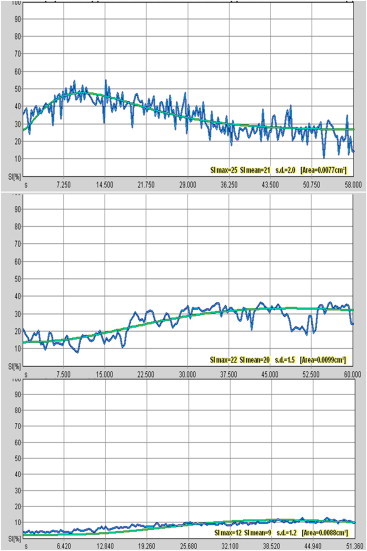
Analysis of CEUS enhancement kinetics. Top: Irregular T/SI curve (early peak of enhancement followed by “wash out”). Middle: Indeterminate T/SI curve (reduction of the slope of enhancement with a lower peak). Bottom: Flat T/SI curves at CEUS, which show a gradual increase in signal intensity.