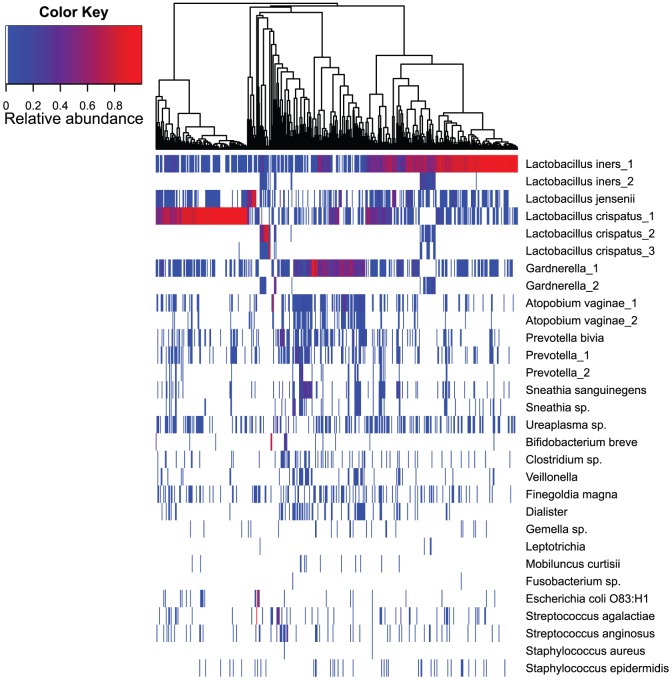
Figure 2. Relative abundance of bacterial OTUs found in the vaginal communities of healthy Estonian women (n = 432).
Bacterial taxonomic assignments are indicated on the right of the heatmap at the Genus and Species level. The relative abundance is color coded and indicated by the color key on the left top of the map. The tree on the top of the heatmap characterizes the similarity of analyzed samples based on OTU composition of vaginal microbiota.

