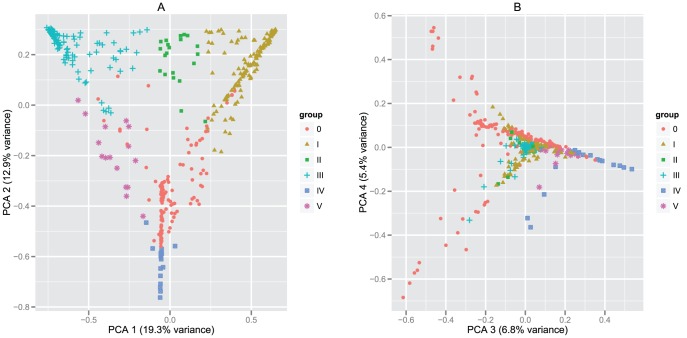
Figure 3. Two-dimensional (2D) plots describing the principal component analysis (PCA) of OTU composition among analyzed samples.
The plots represent 2D projections of a multidimensional analysis where the relative abundance of each specific OTU defines a dimension. Both plots are the projection of the same analysis viewed at a different angle. The plots visualize the clustering and variability of studied vaginal bacterial communities. First (a) 2D plot of the first two PCA components describes the clustering of groups I–V. Second (b) 2D plot of third and fourth PCA component confirms that the samples belonging to non-classifiable group (0) are not clustering into separate or any other entity. The variance described by the respective PCA components (Axis-1 and Axis-2) is written in brackets.

