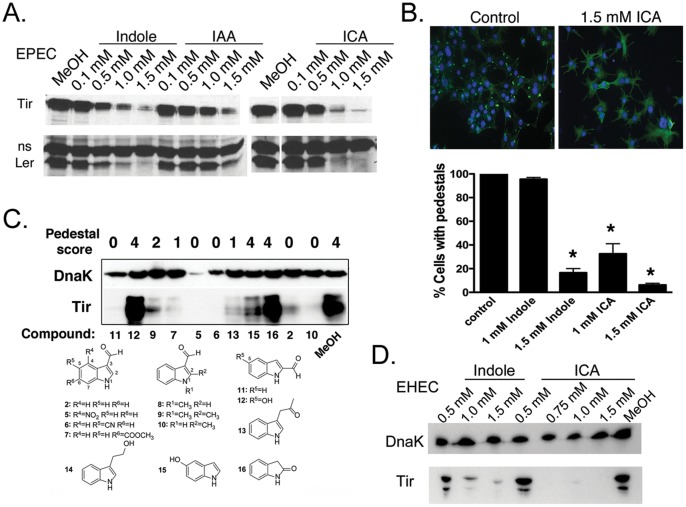
Figure 5. Effects of indole and indole derivatives on LEE gene expression and pedestals.
(a) Western analysis of Tir and Ler expression in EPEC treated with various concentrations of indole, ICA or IAA. The non-specific band recognized by the Ler pAb served as a loading control. In some experiments, DnaK pAb was used as a loading control and gave identical results (see Fig. S4a). (b) Above. Images of 3T3 cells infected for 5 hours with EPEC and treated with 1.5 mM ICA or left untreated. Cells were stained with FITC Phalloidin to recognize actin and DAPI to recognize DNA. At this magnification, pedestals are seen as bright green “dots.” Magnification 200×. Below. Quantitation of pedestal formation in 3T3 cells infected with EPEC in the presence of indole or ICA at various concentrations. Mean +/− SEM are shown; * corresponds to p<0.01 with respect to untreated control. (c) Western analysis of Tir and DnaK expression in EPEC treated with various synthetic indole derivatives each at 1.5 mM. High Tir levels correlated with pedestal formation, and low DnaK levels correlated with slower growth. Pedestal scoring scale ranged from 0 to 4 (0 corresponds to no pedestals and 4 to pedestal formation as in control). Structures and growth curves are presented in Figs. S1 and S4b, respectively. (d) Western analysis of Tir expression in EHEC O157:H7, strain EDL933 treated with various concentrations of indole or ICA.

