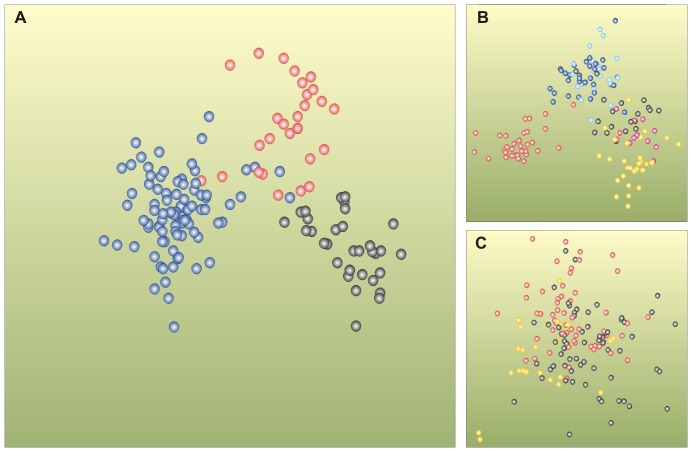
Figure 2. Differentiation of Baltic Sea bacterial communities based on sea phases, depth and sediment composition.
(A) Shea phases: black filled circles indicate sediment samples from the Early Litorina, red from the Litorina and blue from the Late Litorina sea phases. (B) Depth classes: pink-filled circles indicate sediment samples from 533.5 to 500.75 cm, yellow from 494.85 to 403.75 cm, black from 393.7 to 301.35 cm, turquoise from 297.5 to 203.50 cm, blue from 199 to 101 cm and red from 96 to 18.25 cm below the seafloor. (C) Sediment composition: black-filled circles indicate laminae, yellow bioturbated and red homogeneous sediment layers. Generalized discriminant analysis was based on Bray and Curtis distances of bacterial terminal restriction fragments of the 16S rRNA gene (n = 148×199). Correct classification was a) 90.5%, b) 78% and c) 52.7%. Test statistics with 9999 permutations resulted in a highly significant p value for a) and b) (p = 1e-04) which allows rejection of the null hypothesis of no differences among the a priori groups. The default option of canonical analysis of principal coordinates, which combines unconstrained and constrained multivariate methods, resulted in a) 24, b) 23 and c) 13 principal component axes that were further analyzed by generalized discriminant analysis. The first and second canonical axes were plotted here.

