
Figure 3. Effects of BPA on hIAPP aggregation.
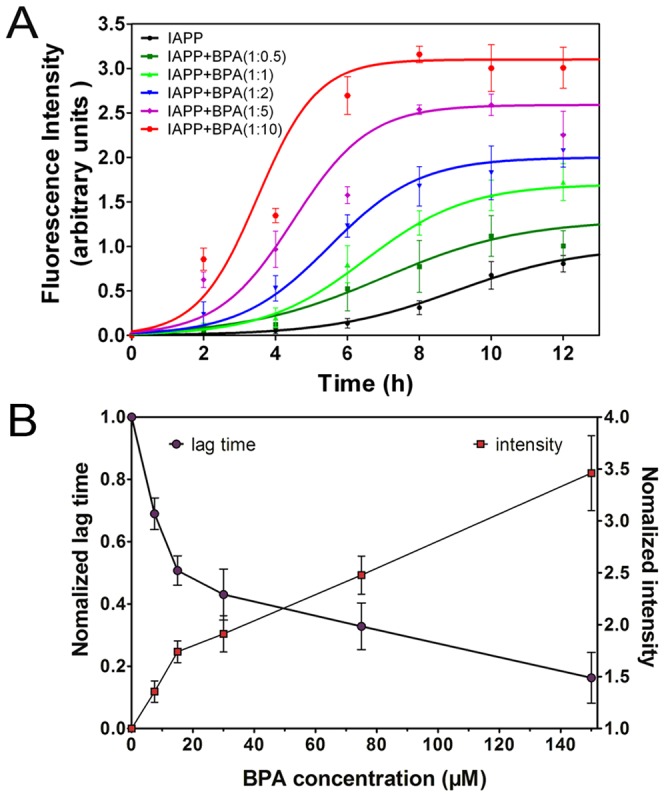
(A) ThT-fluorescence of hIAPP co-incubated with different ratios of BPA recorded in 25 mM PBS (pH 7.4) at 25°C; (B) Normalized lag time (purple circle) and fluorescence intensity (red square). The data of hIAPP without BPA was set as 1. Concentration of hIAPP was 15 µM.