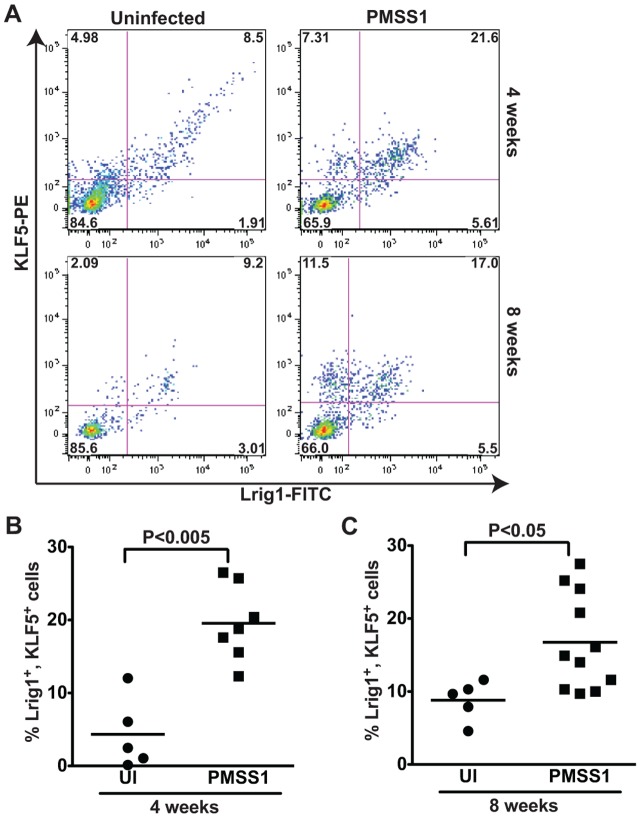
Figure 6. H. pylori induces expansion of a KLF5+, Lrig1+ cell population in vivo.
(A) Flow cytometry dot plots demonstrate Lrig1 and KLF5 immunostaining in representative gastric epithelial cells from uninfected and H. pylori-infected mice at 4 and 8 weeks. The percentage of Lrig1+, KLF5+ cells was quantified in uninfected and H. pylori-infected mice at 4 weeks (B) and 8 weeks (C). Each data point represents gastric epithelial cells analyzed from a single animal and mean values are shown. Circles designate uninfected mice, and squares represent H. pylori-infected mice. Mann-Whitney and ANOVA tests were used to determine statistical significance between groups.

