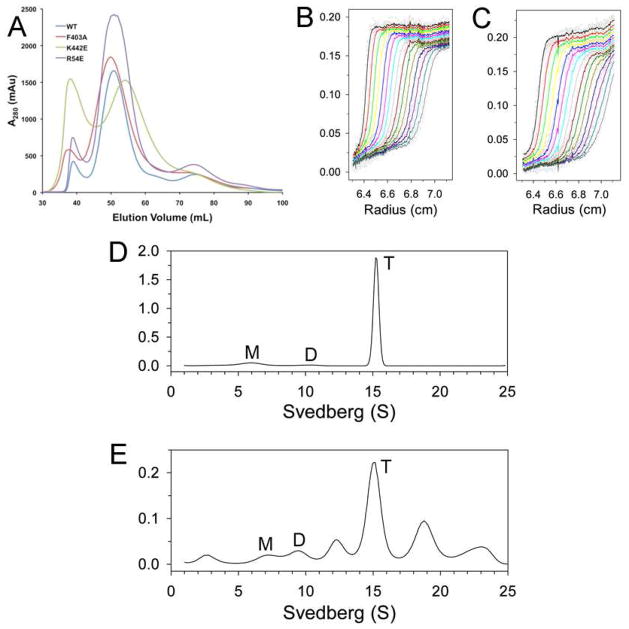
Figure 2. Oligomerization states of the dimer interface mutants in solution.
(A). Gel filtration profiles (from an S300 column) for wild-type SaPC and the dimer interface mutants. (B). Sedimentation velocity AUC data for wild-type SaPC at 1.5 μM concentration. The observed data are shown as open circles, and the theoretical fit to the data based on a rapid monomer-dimer-tetramer association model is shown as the curves. (C). Sedimentation velocity AUC data for the K442E mutant at 1.5 μM concentration. (D). Size distributions of wild-type SaPC in solution at 1 mg/ml concentration, based on the best-fit results by the continuous size distribution analysis (30). M: monomer, D: dimer, T: tetramer. (E). Size distributions of the EcBC chimera in solution at 1 mg/ml concentration.

