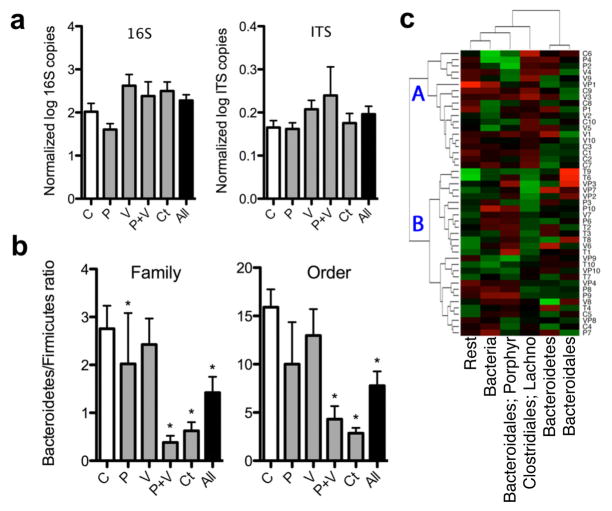
Figure 3. Changes in the faecal gut microbiome after 50 days of STAT.
a, There were no significant differences in microbial census between the STAT and control groups (n = 10 mice per group) evaluated by qPCR with universal primers for 16S rRNA and internal transcribed spacer (ITS). b, By 454-pyrosequencing, Firmicutes were shown to be increased in the STAT mice at multiple taxonomic levels. (Controls n = 10, penicillin n = 9, vancomycin n = 10, penicillin plus vancomycin n = 8, chlortetracycline n = 10; *P < 0.05.) Data are presented as mean ± s.e.m. c, Heat map of specimens showing relative abundance of bacteria present at >1% at the family taxonomic level. Hierarchical clustering based on Euclidean distance identified nonrandom branch distributions of control and STAT mice (P < 0.05). Lachno., Lachnospiraceae; Porphyr., Porphyromonadaceae.

