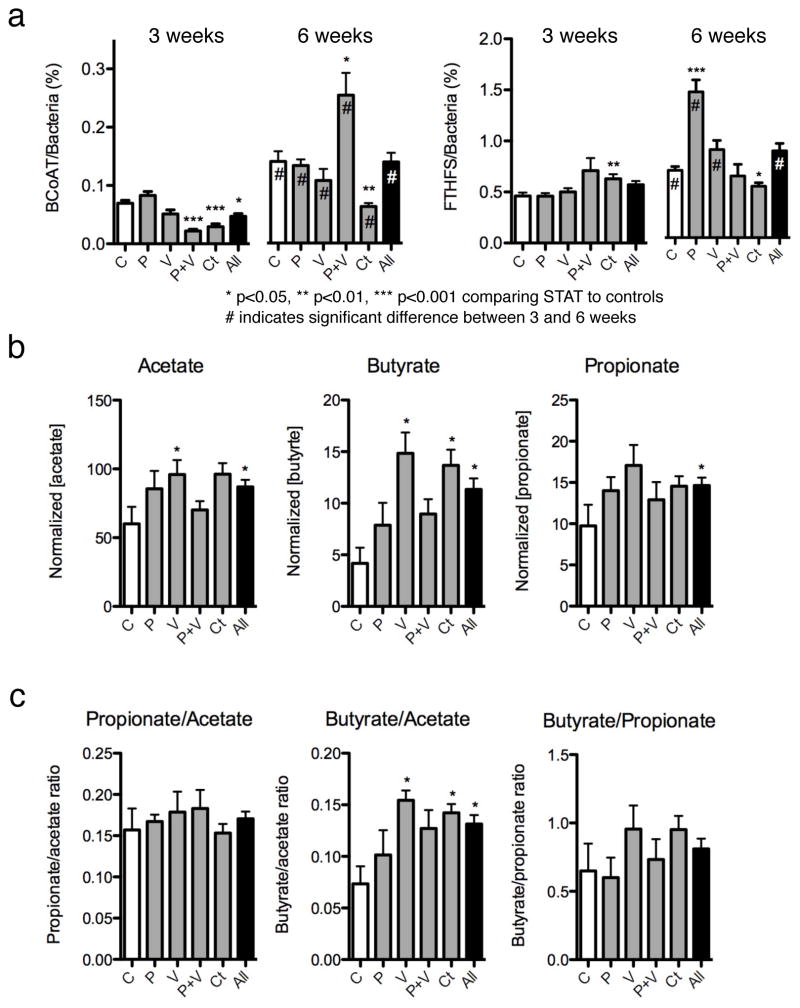
Figure 4. Caecal SCFA production after STAT exposure.
a, Quantitative PCR was performed for butyryl CoA transferase (BCoAT) and formyltetrahydrofolate synthetase (FTHFS) at experiment weeks 3 and 6 on STAT and control groups (n = 10 mice per group). At 3 weeks, BCoAT was diminished in two STAT groups and the aggregate group, a difference that persisted only in the chlortetracycline group. FTHFS copies do not show a consistent pattern. *P < 0.05, **P < 0.01, ***P < 0.001 comparing STAT to controls; hash symbol indicates significant difference between 3 and 6 weeks. b, SCFA concentration analysed by gas chromatography (GC) shows increases in SCFAs in each of the STAT groups compared to controls. c, The ratio of butyrate relative to acetate is significantly higher in the STAT mice than controls. Data are presented as mean ± s.e.m.

