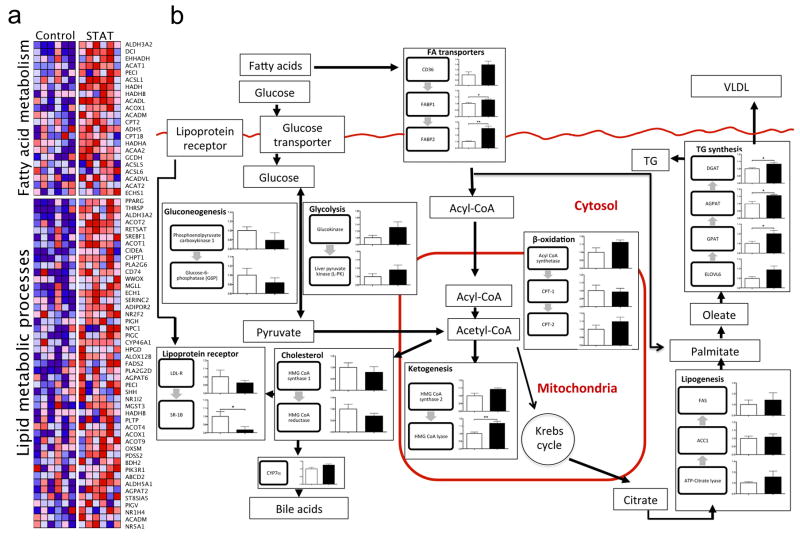
Figure 5. Differentially regulated genes related to hepatic lipogenesis, identified through microarray and quantitative PCR analyses.
a, Microarray analysis of liver specimens surveyed for differences in >45,000 genes; 397 genes were significantly up- or downregulated. Heat maps generated by gene set enrichment analysis (GSEA)43 identify differences between the STAT and control mice (n = 6 mice per group), including pathways related to fatty acid metabolism and lipid metabolic processes. b, Mapping of metabolic genes detected by microarray onto specific pathways, including those related to lipogenesis and triglyceride synthesis, show consistent changes with STAT. Data are presented as mean ± s.e.m. White bars, controls; black bars, STAT; *P < 0.05, **P < 0.01. TG, triglycerides; VLDL, very low density lipoproteins.

