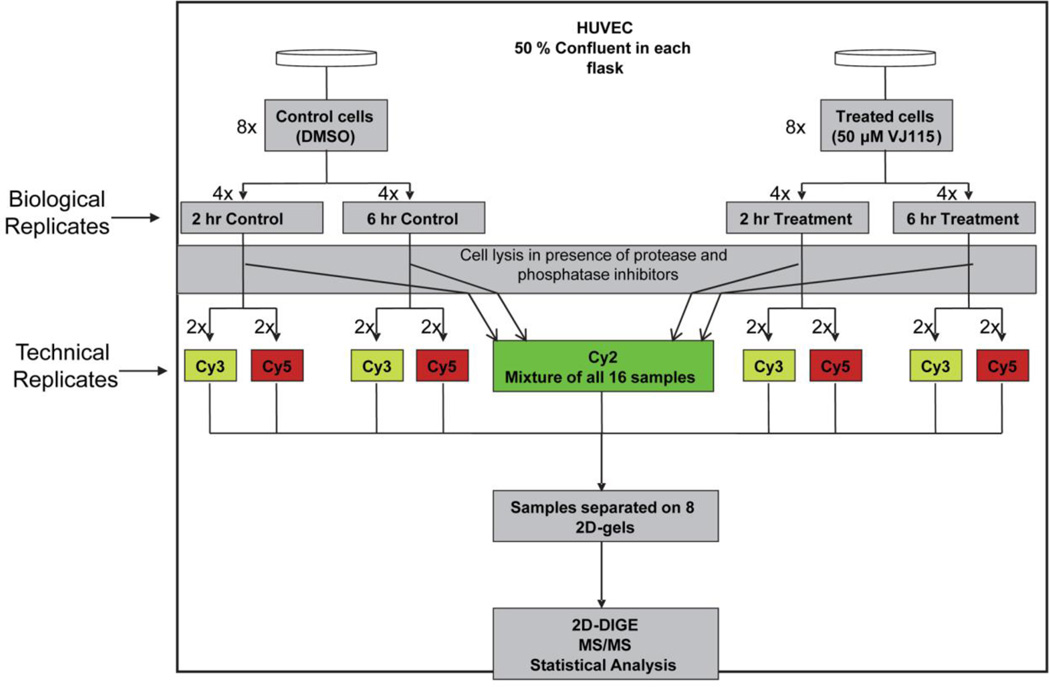
Figure 2.
Schematic illustration of experimental setup for studying global proteome dynamics in HUVECs exposed to VJ115. Passage 3 HUVECs at 50% confluency were exposed to VJ115 (50 µM). Samples were taken for analysis at 2 time points. At each time point 4 biological replicates were obtained. For 2D-DIGE analysis, 2 of the 4 biological replicates were labeled with Cy3 and the other 2 were labeled with Cy5. All 16 samples were separated by 2D gel electrophoresis using 8 DIGE gels, with each gel containing two of the 16 Cy3/Cy5-labeled samples along with an equal aliquot of the Cy2-labeled internal standard, which is a mixture of equal amounts of total protein from every sample, and is used to normalize ratios between gels and minimize technical variation

