Figure 3.
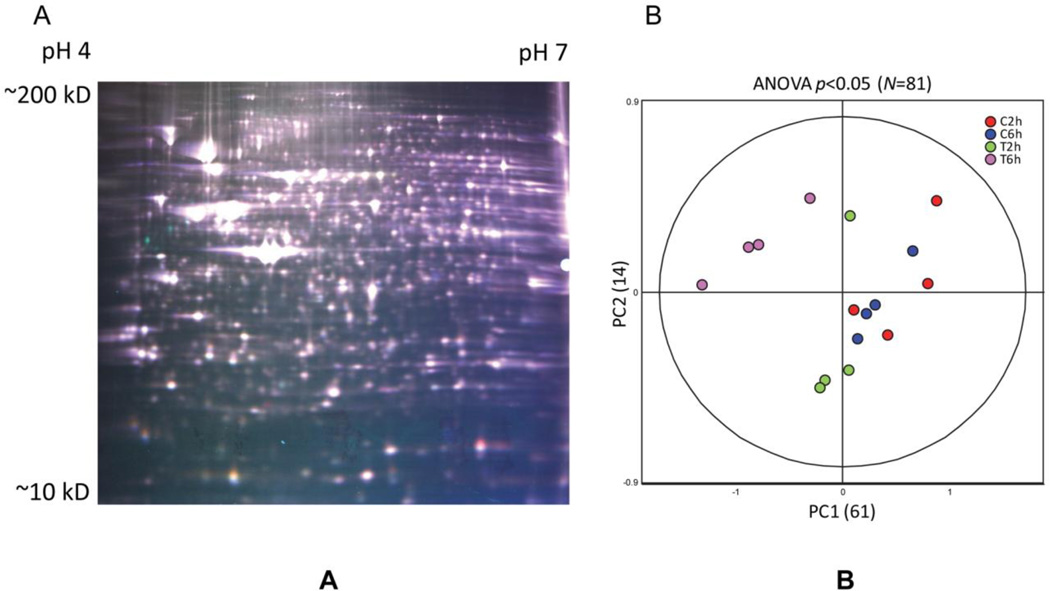
Quality of 2D-DIGE Data. A) False-colored representative DIGE gel from the resulting 8-gel experiment containing three differentially-labeled samples. Cy3-labeled sample-n (false-colored green), Cy5-labeled sample-n (red), and Cy2-labeled pooled-sample internal standard (blue) are overlayed for illustrative purposes, actual data are acquired on each dye separately and quantified relative to the internal standard as described in Materials and Methods. B) Principle analysis (PCA) properly groups the 16 individual DIGE expression maps differentiated by two principle components, PC1 and PC2, and demonstrates high reproducibility between the replicate samples within each group. PC1 distinguished 61% of the variance, with 14% additional variation distinguished by PC2. PCA was performed using expression values from 81 proteins exhibiting ANOVA P-values <0.01

