
Figure 3.
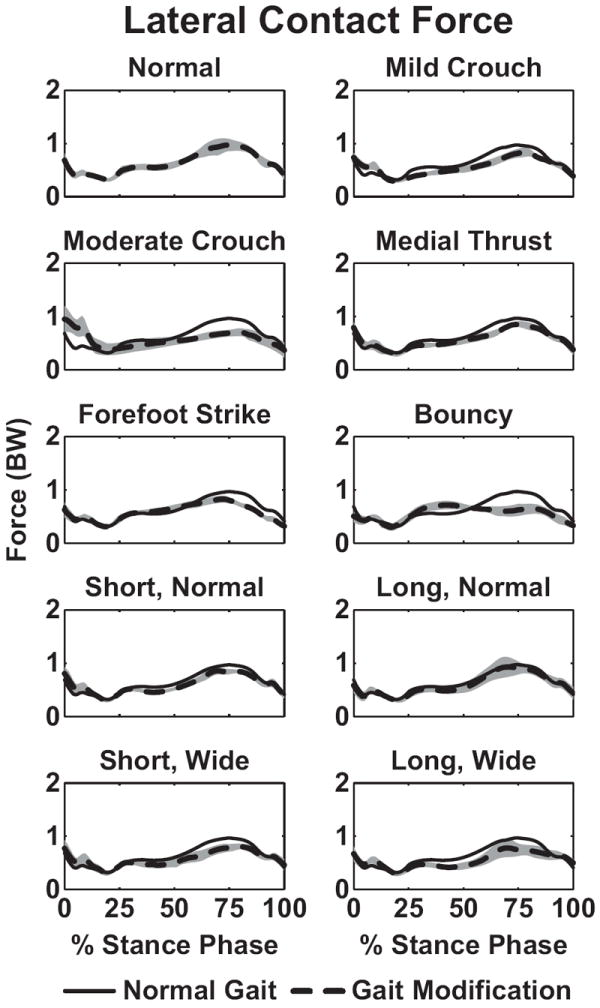
Average curves for lateral knee contact force during the stance phase of gait from five trials of each gait modification. For each gait modification the average data (dashed line) and standard deviation (gray shaded area) are shown. The average curve for normal gait (solid line) is also shown for comparison.