
Figure 1.
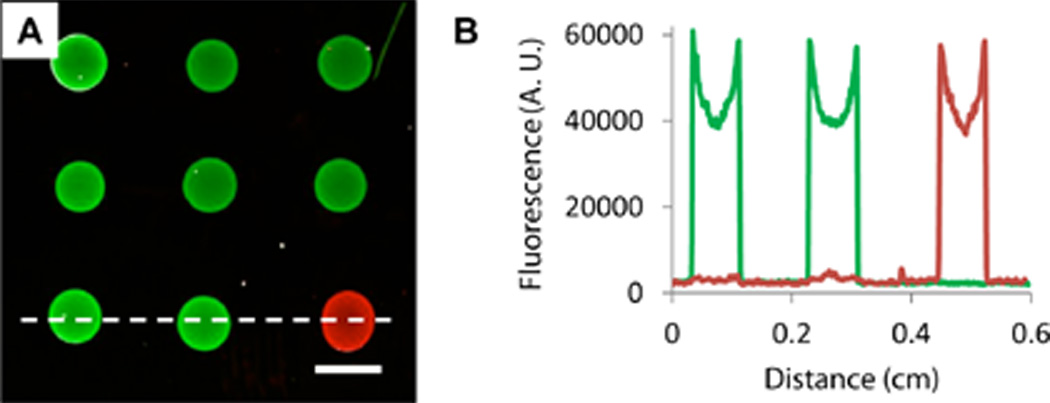
(A) Merged fluorescence micrograph of an oligonucleotide array of Probes 1 and 2 spotted onto a glass slide coated with a PEI/PVDMA film 4.5 bilayers thick. Arrays were hybridized using fluorescein-labeled Complement 1 (green) and Cy3-labeled Complement 2 (red) prior to imaging. Scale bar is 1 mm. (B) Line intensity profiles taken from the bottom row of features of the array in (A) (in a location near the dotted white line) for individual red and green channel images.