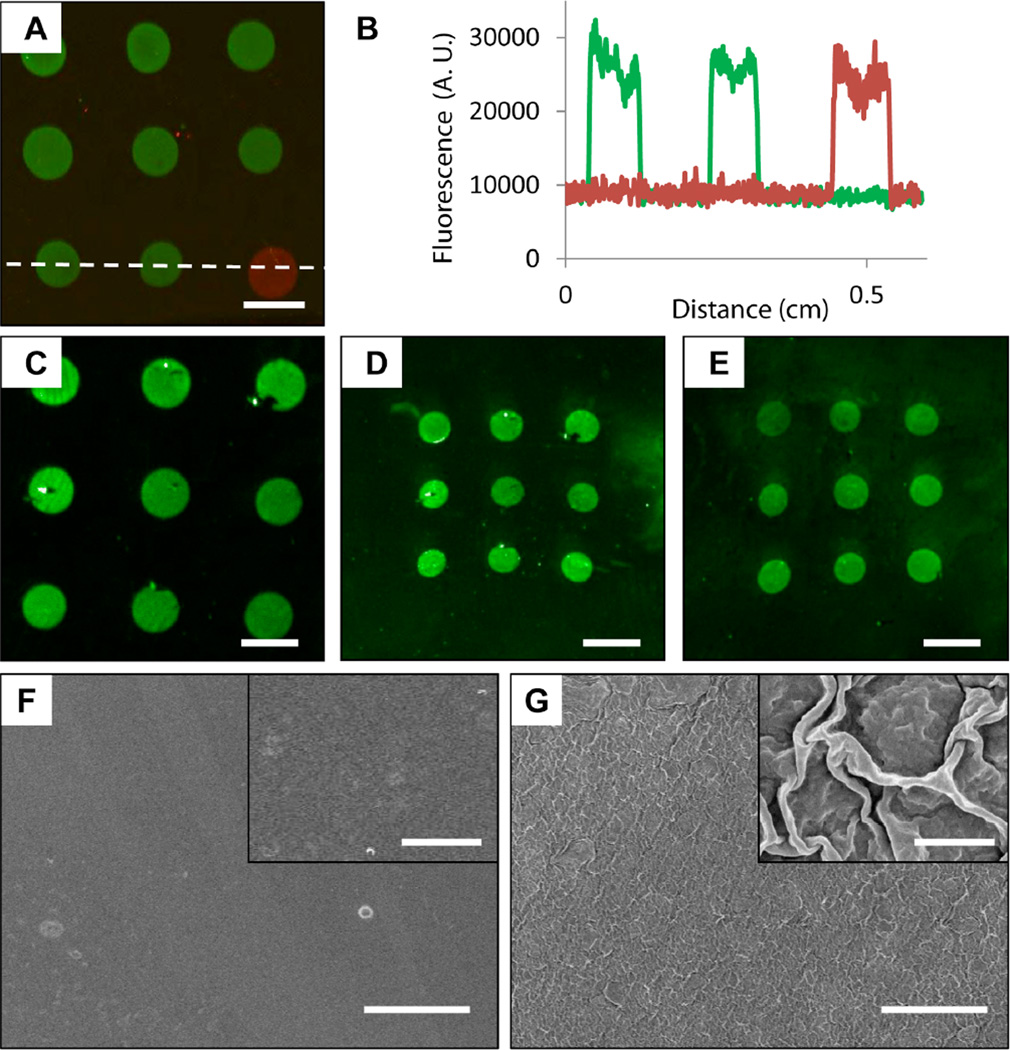
Figure 3.
(A) Merged fluorescence micrograph of an oligonucleotide array of Probes 1 and 2 spotted onto a thin flexible PET sheet coated with a PEI/PVDMA film 4.5 bilayers thick. The array was hybridized using fluorescein-labeled Complement 1 (green) and Cy3-labeled Complement 2 (red) prior to imaging. (B) Line intensity profiles taken from the bottom row of features of the array shown in (A) (in a location near the dotted white line) for the individual red and green channels. (C–E) Fluorescence micrographs of arrays containing Probe 1 spotted onto multilayer-coated heat shrinkable film and hybridized prior to imaging. The images in (C) and (D) are of the same substrate (C) before and (D) after heat treatment to shrink the array; the array in (E) was hybridized and imaged after shrinking of an otherwise similar unhybridized array. (F–G) Scanning electron microscopy images of heat shrinkable film coated with PEI/PVDMA films (F) before and (G) after shrinking. Scale bars are (A, C–E) 1 mm, (F–G) 50 µm, and (F–G, inset) 2 µm.

