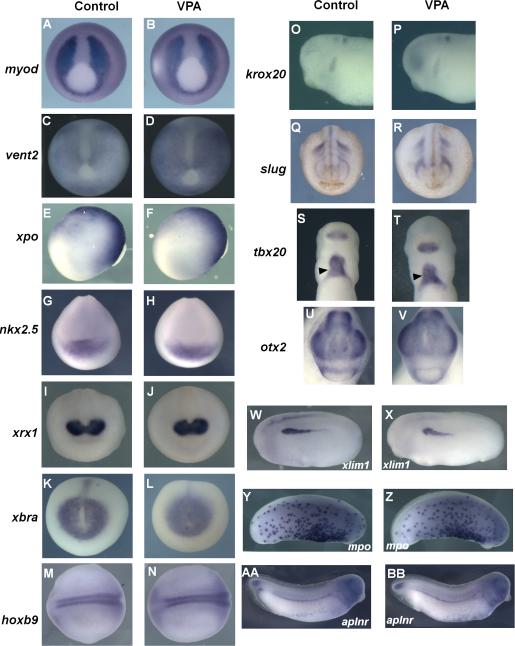
Figure 3. Marker analysis with VPA treatment.
Embryos were treated with buffer control (A,C,E,G, I, K, M,O,Q,S,U,W, Y, AA) or VPA during stage 10-12 (B,D,F,H,J,L,N,P,R,T,V,X, Z, BB) . Whole mount in situ hybridization performed for the indicated markers shows no change in expression with VPA treatment. myod (A,B), vent2 (C,D), nkx2.5 (G,H), xrx1 (I,J), xbra (K,L), slug (Q,R), tbx20 (S,T), otx2 (U,V)- ventral view. xpo (E,F),lim (W,X), krox20 (O,P)- lateral view, anterior to the left, hoxb9 (M,N); dorsal view, anterior to the left. Also unaffected by VPA treatment were VBI derived myeloid marker mpo (Y, Z) and vascular marker aplnr (AA, BB)-lateral view, anterior to the right. myod, vent2, xpo, xbra- late gastrula. nkx2.5, xrx1, slug, hoxb9- neurula stages. lim1, krox20, mpo, aplnr, tbx20, otx2- tailbud stages.

