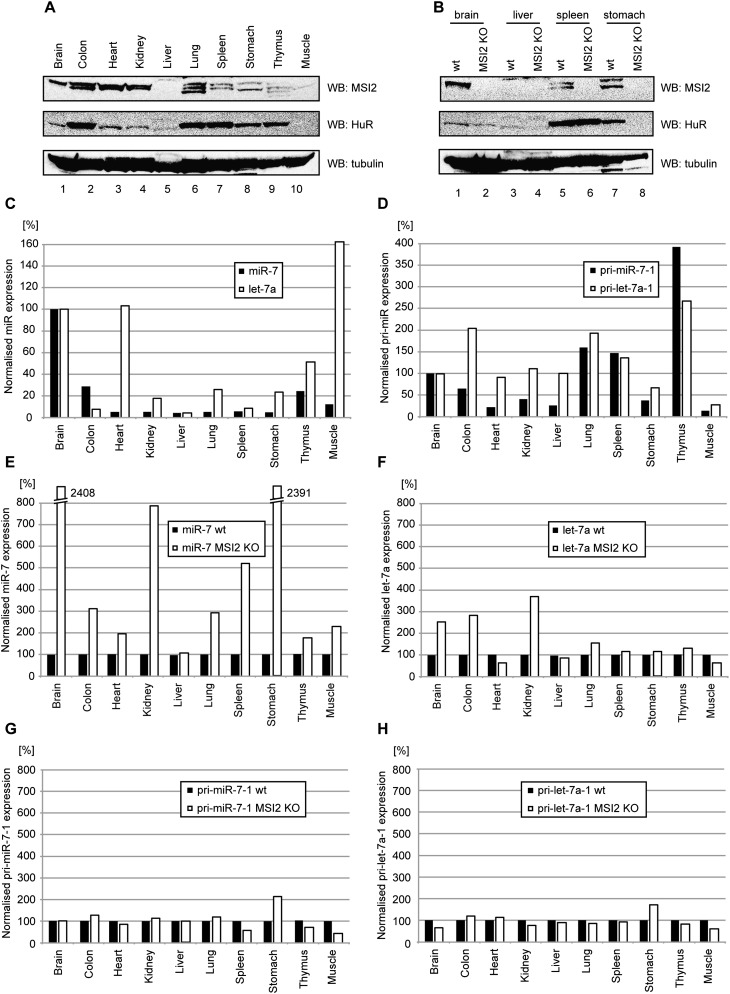
Figure 7.
Brain-enriched miR-7 is up-regulated in a MSI2 KO mouse. (A) Western blot analysis of protein extracts from wild-type mouse tissues using anti-MSI2, anti-HuR, and anti-tubulin. (Lane 1) Brain. (Lane 2) Colon. (Lane 3) Heart. (Lane 4) Kidney. (Lane 5) Liver. (Lane 6) Lung. (Lane 7) Spleen. (Lane 8) Stomach. (Lane 9) Thymus. (Lane 10) Muscle. (B) Western blot analysis of protein extracts from selected MSI2 KO mouse tissues. Lanes 1, 3, 5, and 7 indicate extracts from a wild-type mouse, whereas lanes 2, 4, 6, and 8 show proteins derived from a MSI2 KO mouse. (C) Real-time qRT–PCR on miRNAs from 1 μg of total RNA from select wild-type mouse tissues reveals a substantial enrichment of miR-7 (black bars) in brain tissue and a different pattern of let-7a (white bars) in select tissues. The values were normalized to 5S levels. The fold change of miR abundance was plotted relative to the values from brain total RNA, which were set to 100. (D) Real-time qRT–PCR on pri-miRNAs from samples as shown in A show a lack of significant correlation with the abundance of the corresponding mature miRNAs (correlation coefficient = 0.16, P-value = 0.33). Values were normalized to GAPDH levels. The fold change of pri-miRNA abundance was plotted relative to the values from brain total RNA, which were set to 100. (E) Real-time qRT–PCR on miR-7 from total RNA samples derived from wild-type (black bars) and MSI2 KO (white bars) mice show a large increase in the levels of miR-7 in MSI2 KO tissues. Values were normalized to 5S levels. The fold change of miR-7 abundance was plotted relative to values derived from the wild-type mouse, which were set to 100. (F) Real-time qRT–PCR on let-7a from total RNA samples derived from wild-type (black bars) and MSI2 KO (white bars) mice. Data are presented as in E. (G,H) Real-time qRT–PCR on pri-miR-7-1 and pri-let-7a-1 from samples as shown in E show very little difference between the wild-type and MSI2 KO mice. Values were normalized to GAPDH levels. The fold change of pri-miR abundance was plotted relative to the values from the wild-type mouse, which were set to 100.

