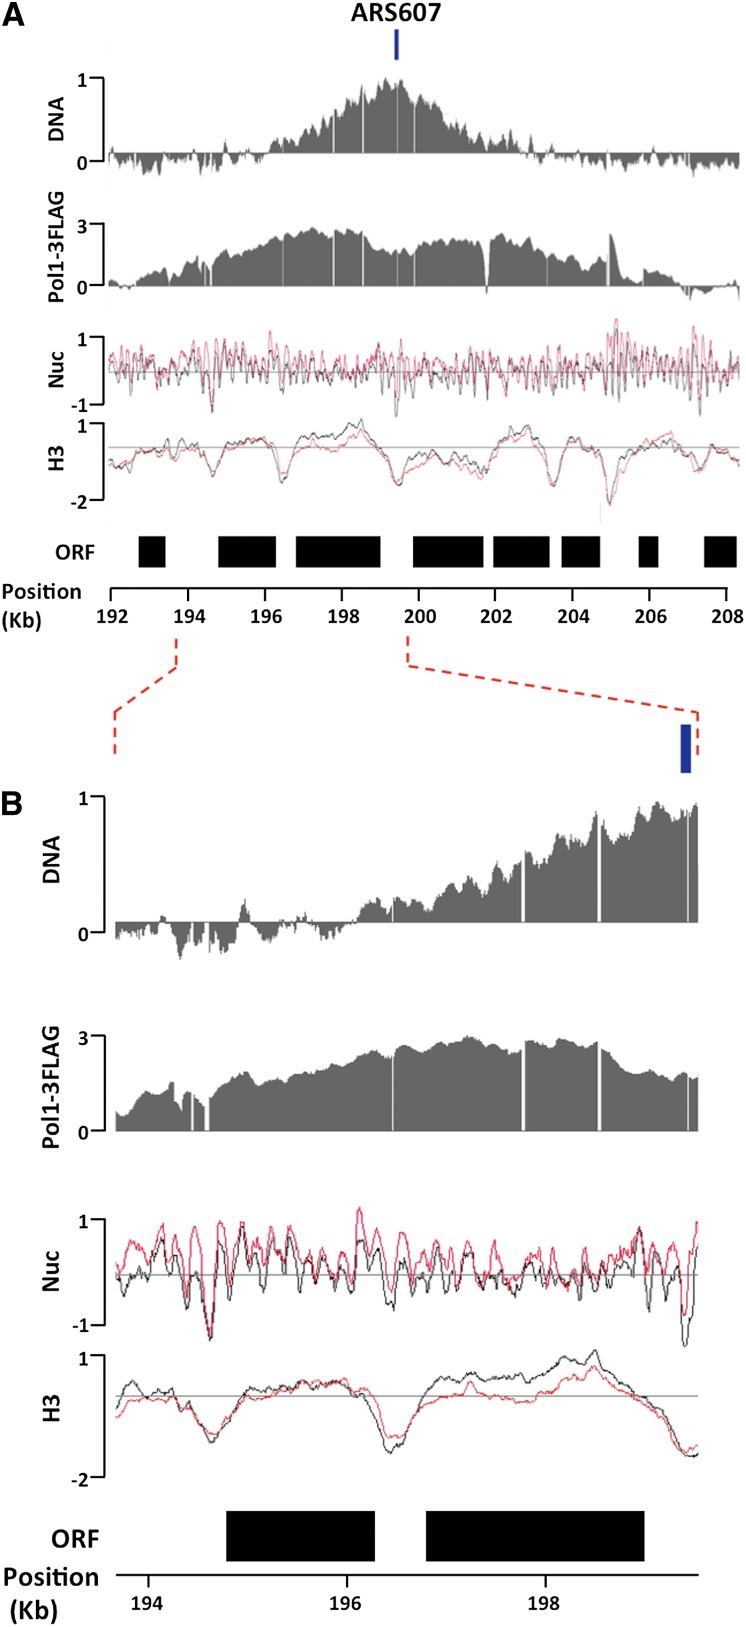
Figure 1.
Analysis of chromatin structure around replication forks. (A) DNA profiles (DNA), DNA Pol I ChIP signals (Pol1-3Flag), nucleosome mapping (Nuc), and H3 ChIP (H3) signals around the efficient early-firing ORI ARS607, whose previously annotated position is delimited by a box above the DNA panel. All Y-axes are on the log2 scale. DNA profile analysis and Pol I ChIP were done in S phase (60 min in HU). Black and red lines in nucleosome mapping and H3 ChIP data correspond to G1 and S phase (60 min in HU) samples, respectively. Black boxes denote the position of ORFs. (B) The same as A, except that the region between the dotted lines is expanded.

