Figure 3.
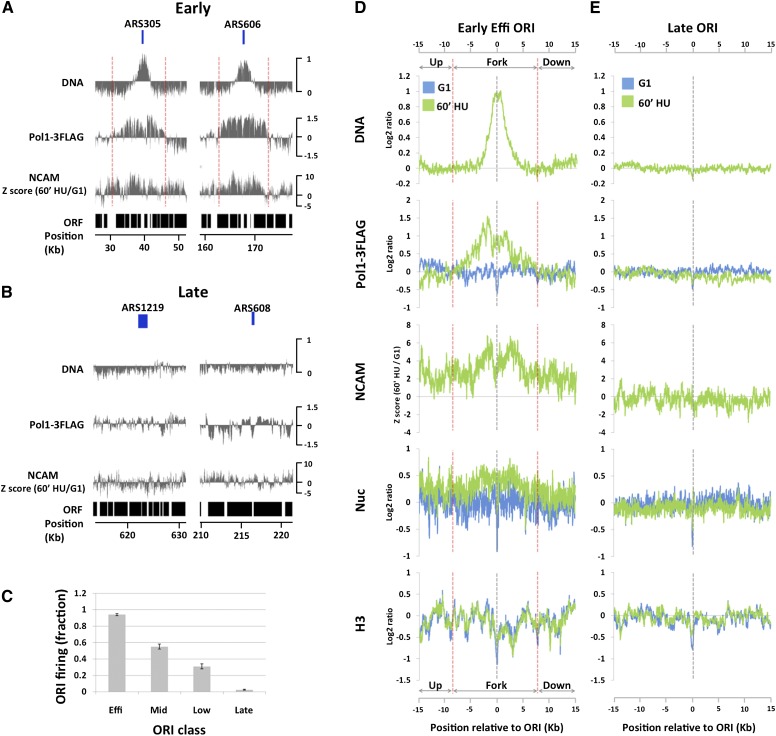
Global analysis of chromatin accessibility around replication forks. (A) DNA profiles (DNA) and Pol I ChIP signals (Pol1-3Flag) in S phase (60 min in HU) and difference in NCAM between S and G1 phases (NCAM) around two efficient early-firing ORIs: ARS305 and ARS606. Previously annotated positions of ARSs are delimited by the boxes above the DNA panels. The Y-axes are on the log2 scale, except for the NCAM panel. The dotted red lines denote replication fork regions where Pol I ChIP signals are above the genome average. (B) The same as A, except that the analyses were done around two late-firing origins: ARS1219 and ARS608. (C) Origin firing efficiencies (mean ± standard error of the mean from two biological replicates), as judged by DNA profile analysis, of different classes of ORIs at the time of the experiment (60 min in HU). (D) DNA profiles (DNA), Pol I ChIP signals (Pol1-3Flag), NCAM signals (NCAM), nucleosome mapping (Nuc), and H3 ChIP signals (H3) averaged from all eight efficient early-firing ORIs on chromosomes III, VI, and XII. G1 data are in blue, and S-phase data (60 min in HU) are in green, except for NCAM signals, which show the differences between S and G1. Data sets are aligned at the peak of DNA profiles, which precisely coincide with the previously published ORI midpoints. The dotted red lines denote replication fork regions where Pol I ChIP signals are above the genome average. The Y-axes are on the log2 scale, except for the NCAM panel. (E) The same as D, except that the data are averaged from 18 late-firing ORIs on chromosomes III, VI, and XII.

