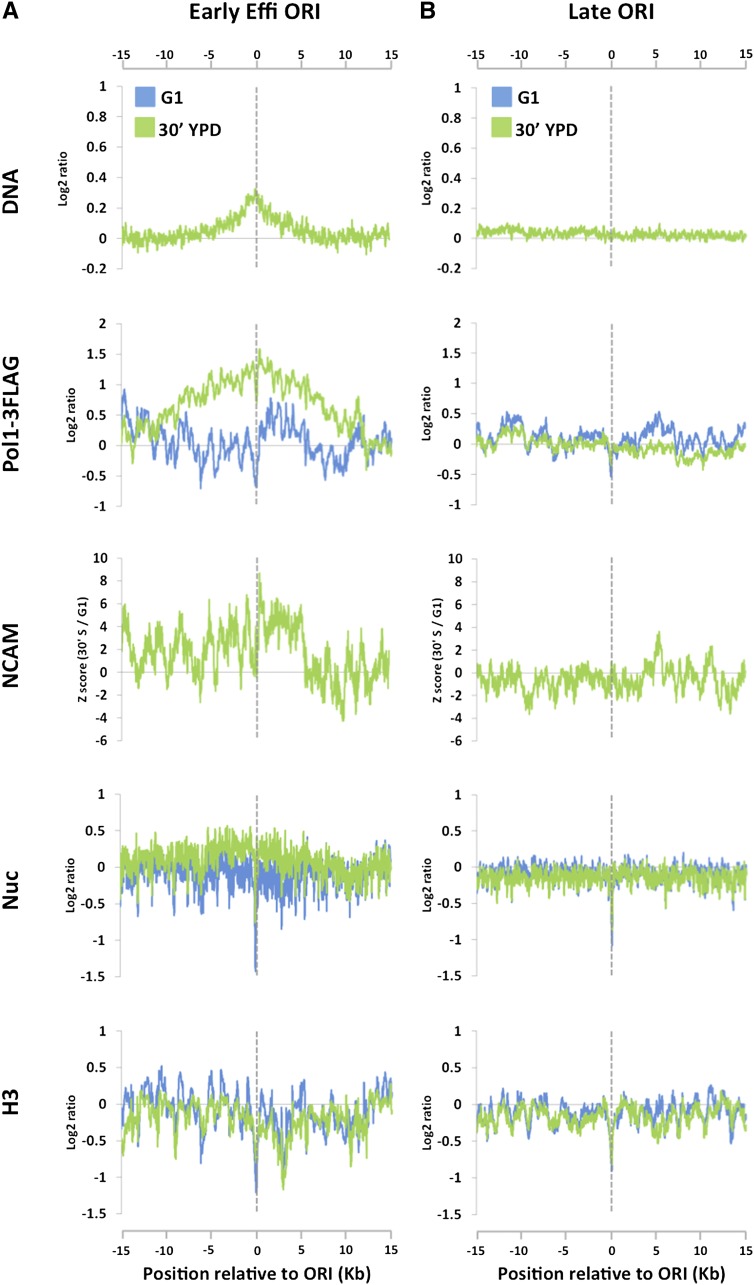
Figure 4.
NCAM signals increase around replication forks during normal S phase. Cells were released from α-factor arrest into rich medium at 24°C, and the NCAM assay was performed during S phase as in Figure 3. (A) DNA profiles (DNA), Pol I ChIP signals (Pol1-3Flag), NCAM signals (NCAM), nucleosome mapping (Nuc), and H3 ChIP signals (H3) averaged from all eight efficient early-firing ORIs on chromosomes III, VI, and XII. G1 data are in blue, and S-phase data (30 min in S phase) are in green, except for NCAM signals, which show the differences between S and G1. Data sets are aligned at the peak of DNA profiles, which precisely coincide with the previously published ORI midpoints. The Y-axes are on the log2 scale, except for the NCAM panel. (B) The same as A, except that the data are averaged from 18 late-firing ORIs on chromosomes III, VI, and XII.

