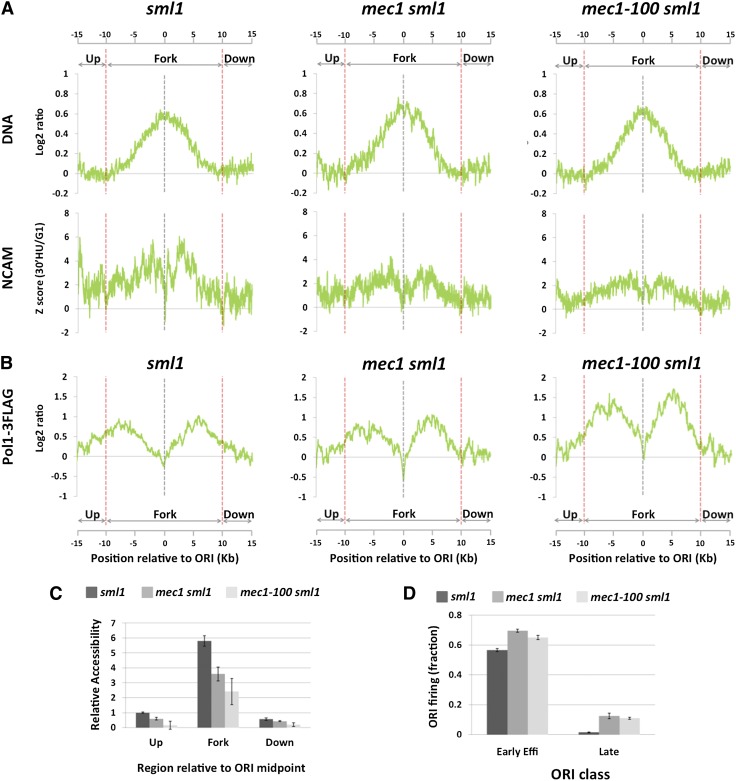
Figure 5.
MEC1-dependent increase in chromatin accessibility around replication forks. (A) DNA (DNA, top panels) and NCAM (NCAM, bottom panels) profiles at early efficient ORIs (n = 8) by 30 min in S phase in the presence of 200 mM HU in sml1, mec1-100 sml1, and mec1-100 sml1 mutant strains. (B) Same as in A for Pol1-3Flag signal profiles. (C) Quantification of the relative increase in NCAM between G1 and S phases from A in sml1, mec1 sml1, and mec1-100 sml1 cells upstream of, within, and downstream from replication fork regions. The value upstream of the replication fork region in sml1 cells is set as 1.0. (D) Origin firing efficiencies, as judged by DNA profile analysis, of early efficient and late-firing ORIs in sml1, mec1 sml1, and mec1-100 sml1 cells at the time of the experiment (30 min in HU). Values in panels C and D express the mean ± standard error of the mean from two independent biological replicates.

