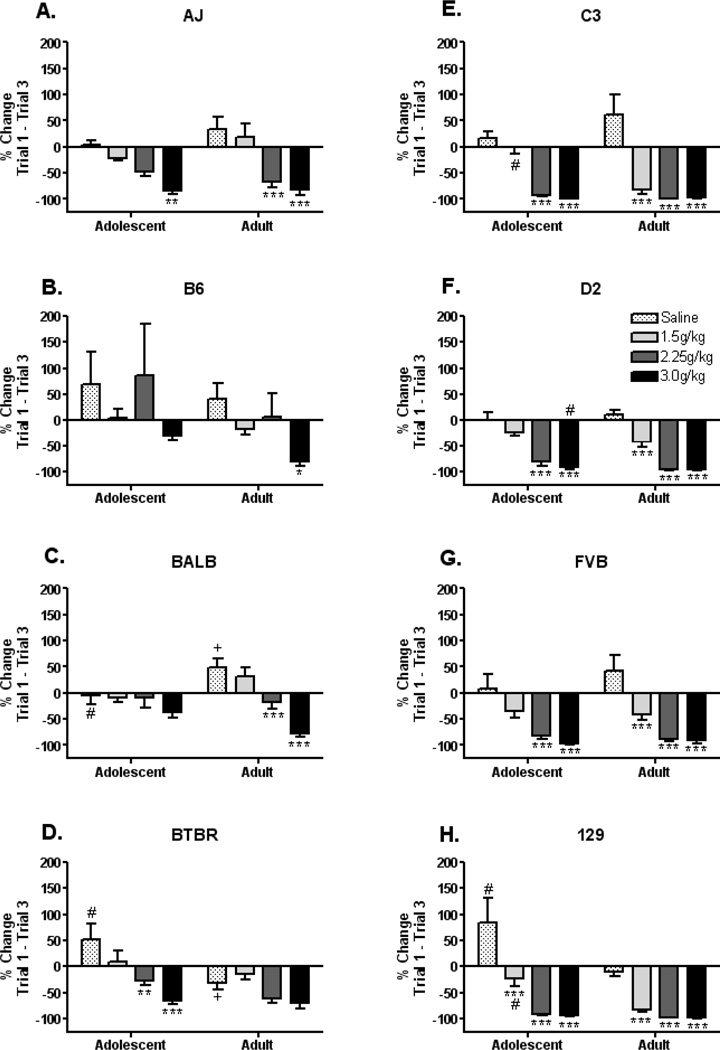
Figure 2. Ethanol induced conditioned taste aversion: percent change from trial 1 to trial 3.
(A) AJ adolescents display a CTA response at 3.0g/kg ethanol, while adults display a CTA response at 2.25 and 3.0g/kg ethanol. (B) B6 adolescents do not display a CTA response at any of the doses tested, however B6 adults display a CTA response at 3.0g/kg ethanol. (C) BALB adolescents do not display a CTA response at any of the doses tested, however BALB adults display a CTA response at 2.25 and 3.0g/kg ethanol. (D) BTBR adolescents display a CTA response at 2.25 and 3.0 g/kg ethanol, but BTBR adults do not display a significant CTA response at any of the doses tested, likely because they reduce NaCl intake following saline injections. (E) C3 adolescents display a CTA response at 2.25 and 3.0 g/kg ethanol, while C3 adults display a CTA response at all ethanol doses (1.5, 2.25 and 3.0 g/kg). (F) D2 adolescents display a CTA response at 2.25 and 3.0g/kg ethanol, while D2 adults display a CTA response at all ethanol doses (1.5, 2.25, 3.0 g/kg). (G) FVB adolescents display a CTA response at 2.25 and 3.0g/kg ethanol, while FVB adults display a CTA response at all ethanol doses (1.5, 2.25, 3.0 g/kg). (H) 129 adolescents and adults display a CTA response at all ethanol doses, however the adolescents do not display as large of a reduction at the 1.5g/kg ethanol dose as do the adults. (*=p<0.05, **=p<0.01, ***=p<0.001; the asterisks (*) indicates significant difference from saline control within age-group; # indicates significant age difference at the same dose; + indicates a significant change from zero in the saline treated group).

