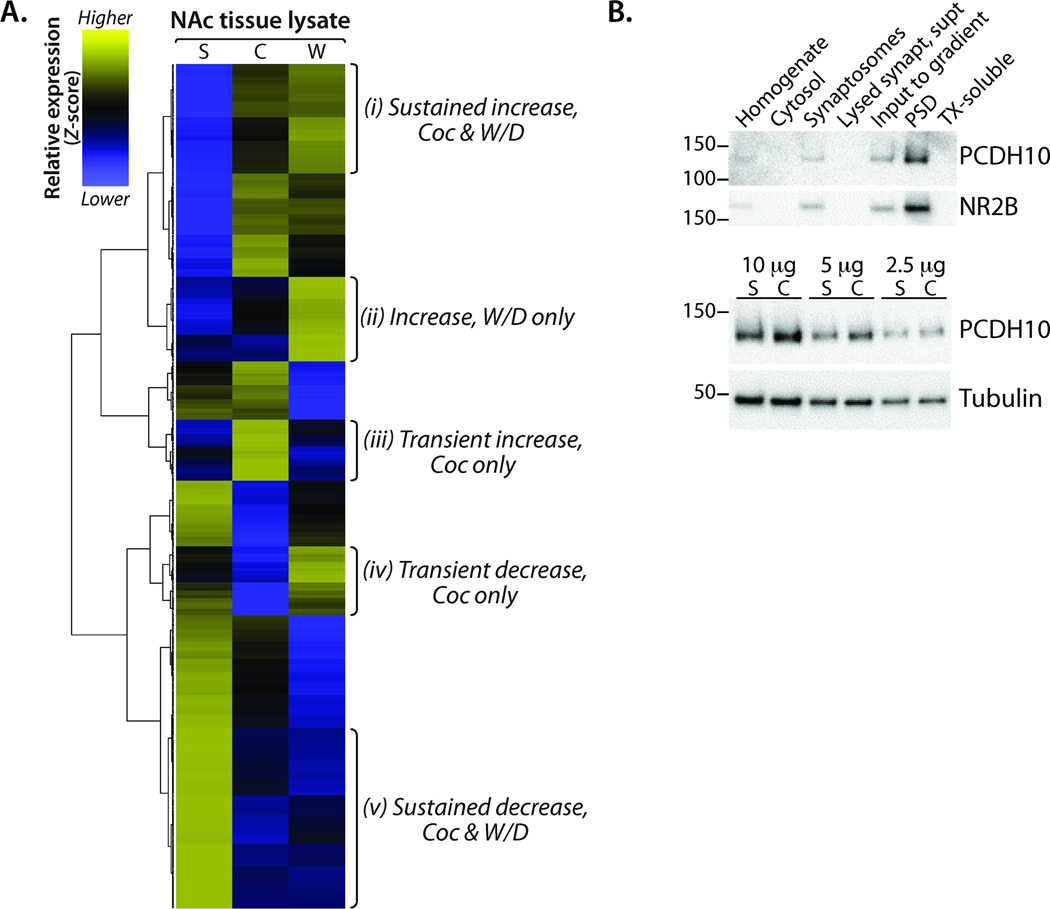
Figure 2. Differential regulation of clusters of genes in the NAc following cocaine and withdrawal.
(A) Normalized mRNA frequency as a function of total reads for NAc lysate libraries (Saline, Cocaine, Withdrawal) was calculated for all genes in which one sample had an RPKM ≥ 1.0 (n = 13,184). Hierarchical gene expression clustering using Gene Cluster 3.0 and Java TreeView generated the dendrogram and heat map. Z-score was computed on normalized mRNA frequency across all samples. Blue, low expression; yellow, high expression; grey, no expression. Gene lists from the indicated Clusters (i-v) were used in subsequent protein class and pathway analyses. (B) The effects of Cocaine on one of the protocadherins identified as a target were verified. Subcellular fractionation of striatal tissue revealed enrichment of PCDH10 at the PSD. PSDs purified from the striata of Saline and Cocaine treated mice were analyzed for PCDH10; after normalization to βIII tubulin, the Coc/Sal ratio for PCDH10 rose 24% (P < 0.01; t-test).

