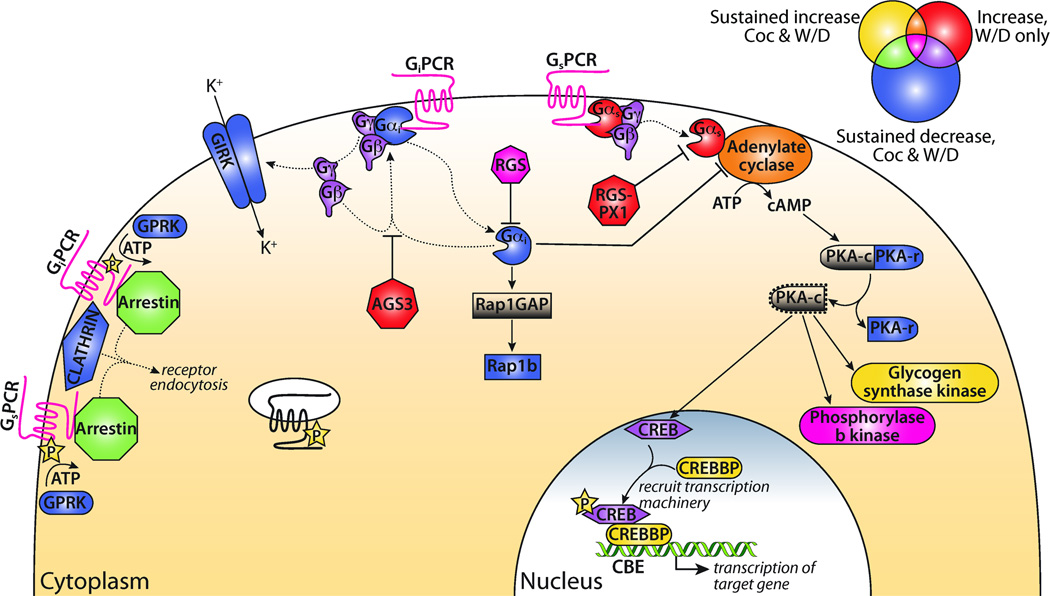
Figure 3. Gαi and Gαs heterotrimeric G-protein signaling schematic.
Model based on Panther Pathway diagram (http://www.pantherdb.org). Venn diagram depicts color key for signaling components. Genes labeled yellow showed a sustained increase in Coc and W/D (cluster i), red genes increased in W/D only (cluster ii), and blue genes had decreased expression in both Coc and W/D (cluster v); overlap colors indicate contribution of > 1 cluster to signaling group. For example, GPCRs, which appear in all three clusters, are shown in magenta. Genes from Clusters i, ii, and v were used for this analysis. Abbreviations: Coc, Cocaine; W/D, Withdrawal.

