Fig. 4.
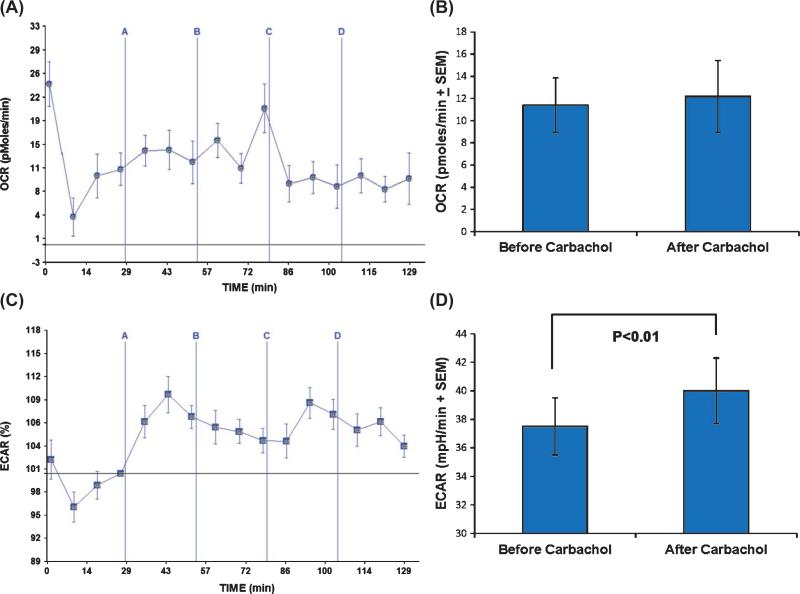
Carbachol affects the ECAR but not the OCR of SH-SY5Y ρ0 cells. SH-SY5Y ρ0 cells were exposed to carbachol in injection A, oligomycin in injection B, FCCP in injection C, and rotenone/myxothiazol in injection D. A) ρ0 cells have a very low OCR, and this rate shows very little variation when carbachol is added, ATP synthase is inhibited, or mitochondrial membranes are permeabilized. Lack of a clear rotenone/myxothiazol response indicates very little, if any, of the oxygen consumed by these cells is consumed by the mitochondrial electron transport chain. Variability at each measured time point is shown as SEM. B) Carbachol did not increase the OCR, even when before and after treatment readings were compared by a paired t-test approach. C) The ECAR, though, did change from its pre-carbachol baseline once carbachol was added. The vertical axis in this panel shows the post-carbachol ECAR percent change from the pre-carbachol ECAR baseline (point 4), as this view best illustrates the effect. Variability at each measured time point is shown as SEM. D) Although the magnitude of the carbachol-induced ECAR change was small, the pre and post carbachol treatment values were different when compared using a paired t-test approach.

