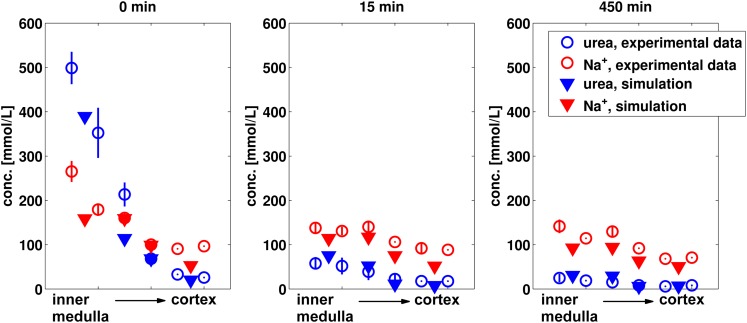
Figure 6.
Predicted sodium and urea kidney concentrations after 15 and 450 min of mannitol infusion in comparison to experimental data (Atherton et al., 1968). The values for non-diuretic control (0 min) are given for comparison. The simulated values for the four kidney regions are compared to the experimental values from six kidney sections (papillary tip, papillary base, inner medulla, outer medulla, inner cortex, and outer cortex).

