Figure 7.
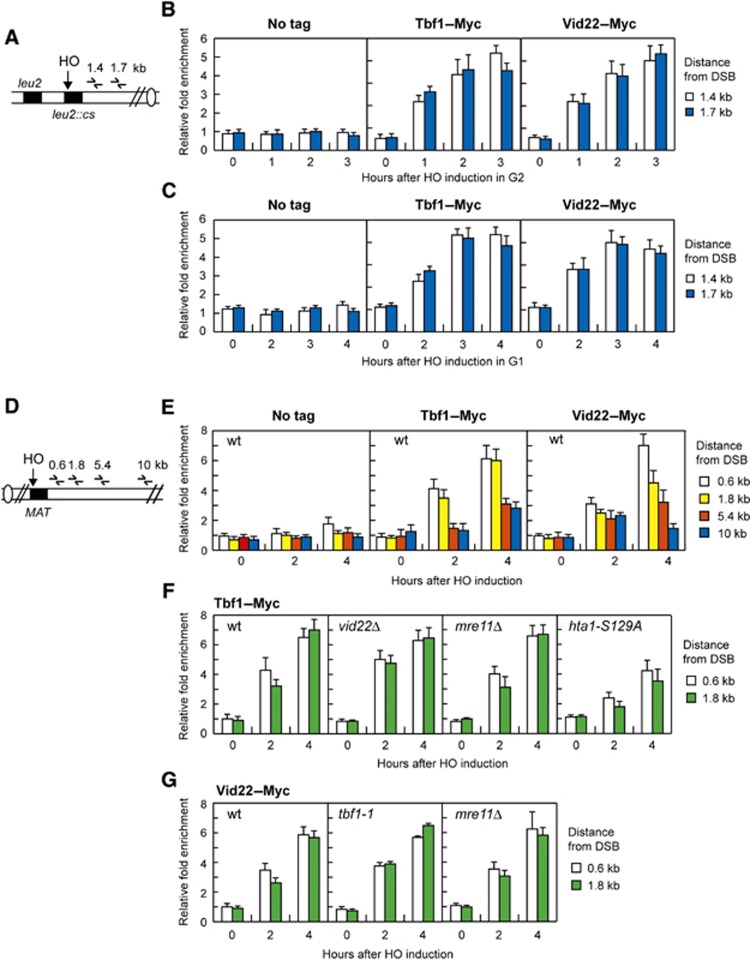
Tbf1 and Vid22 recruitment at chromosomal DSBs. (A) Schematic representation of the qPCR primer sets located at the indicated distance from the HO cleavage site at the LEU2 locus. (B) Exponentially growing YEPR wild-type cells carrying the HO system in (A) and expressing fully functional Tbf1–Myc or Vid22–Myc fusion proteins or not expressing any Myc-tagged protein (no tag) were arrested in G2 (time zero) with nocodazole and transferred to YEPRG in the presence of nocodazole. Relative fold enrichment of Tbf1–Myc or Vid22–Myc at the indicated distance from the HO cleavage site was calculated after ChIP with an anti-Myc antibody. (C) As in (B) but showing relative fold enrichment of Tbf1–Myc or Vid22–Myc fusion proteins in G1-arrested wild-type cells. (D) Schematic representation of the qPCR primer sets located at the indicated distance from the HO cleavage site at the MAT locus. Donor HML and HMR loci are deleted. (E) Exponentially growing YEPR wild-type cell cultures carrying the HO system in (D) and expressing fully functional Tbf1–Myc or Vid22–Myc fusion proteins or not expressing any Myc-tagged protein (no tag) were transferred to YEPRG. Relative fold enrichment of Tbf1–Myc and Vid22–Myc at the indicated distance from the HO cleavage site at the MAT locus was calculated after ChIP with an anti-Myc antibody. (F) As in (E) but showing relative fold enrichment of Tbf1–Myc fusion protein in wild-type, vid22Δ, mre11Δ and hta1-S129A hta2Δ cells. (G) As in (E) but showing relative fold enrichment of Vid22–Myc fusion protein in wild-type, tbf1-1 and mre11Δ cells. In all graphs, data are expressed as relative fold enrichment of Myc-tagged proteins found at the HO-cut site over that found at a non-cleavable locus after normalization of each ChIP signals to the corresponding input for each time point. Plotted values are the mean values±s.d. from three independent experiments.

