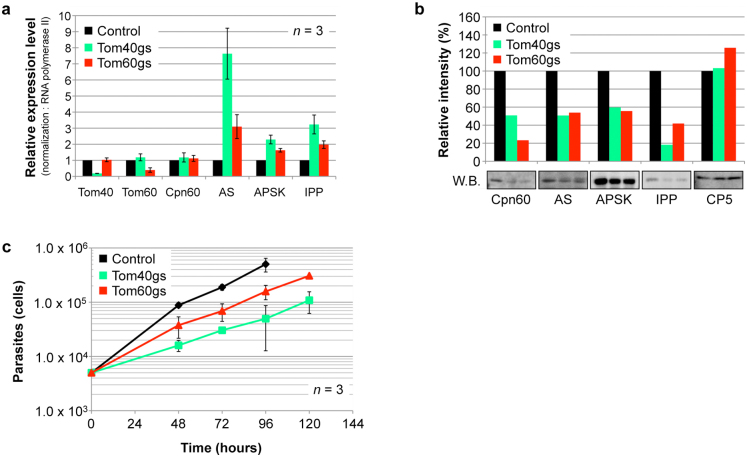
Figure 3. Phenotypes of Tom40- and Tom60-gene silenced strain.
(a), Effects on the relative mRNA expression levels of mitosomal proteins of Tom40- and Tom60-gene silencing. Error bars indicate standard deviations. (b), Effects on the amount of mitosomal proteins in organelle fractions from Tom40-gene silenced (gs) and Tom60gs strains. Cysteine protease 5 (CP5) was used as loading control. Relative levels of each transcript and protein are shown after normalization against control. (c), Growth kinetics of Tom40gs, Tom60gs, and control strains.

