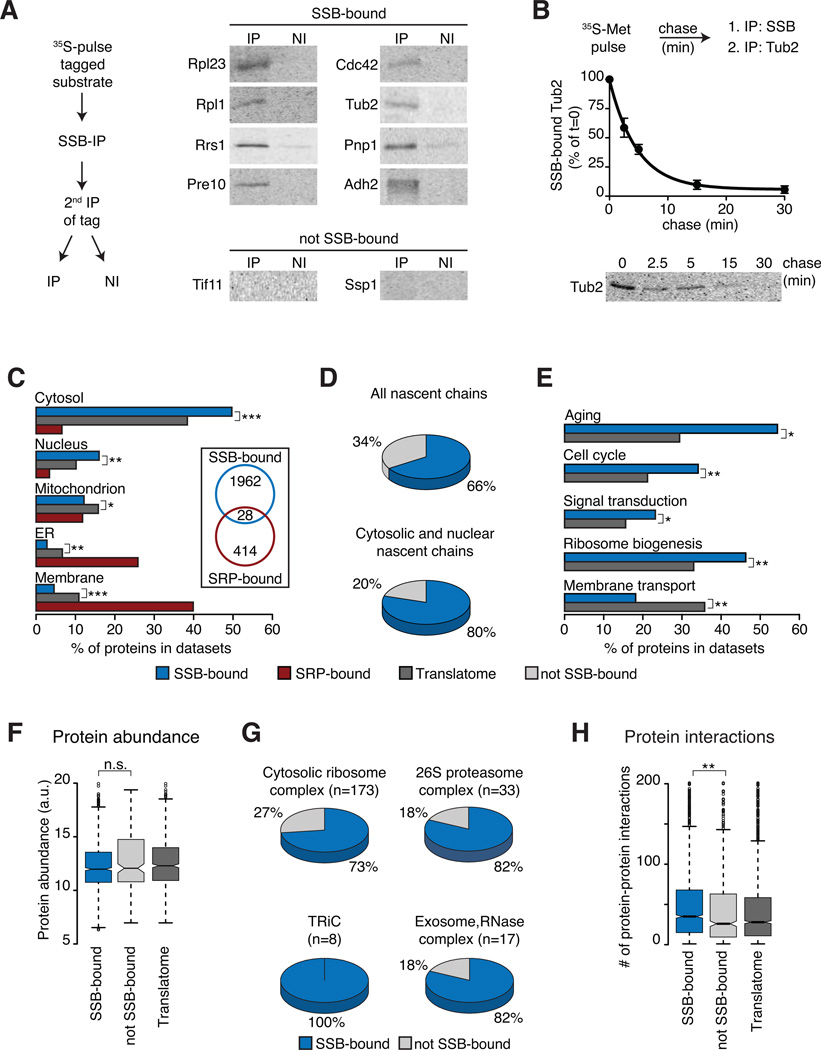
Figure 2. Selectivity of SSB for specific nascent polypeptides.
(A) Direct biochemical interaction of SSB with candidate substrates from Figure 1. N-terminally tagged substrates were briefly 35S-labeled, SSB-bound, labeled substrates were isolated by SSB-IP, and enrichment through a 2nd IP for the tag (IP). Non-immune controls were done in parallel (NI). Samples were analyzed by SDS-PAGE and autoradiography. (B) Flux of identified substrates through SSB. N-terminally tagged Tub2 was 35S-labeled and chased for the indicated times. Samples were processes as in (A) and quantified (mean ± SEM, n=3). (C) Subcellular localization of SSB and SRP substrates versus the Translatome is plotted as fraction of the datasets (%). Insert highlights low overlap between SSB and SRP substrates. (D) SSB substrates within the Translatome (top) and fractions of cytosolic and nuclear proteins. (E) SSB substrates are enriched in key cytoplasmic regulatory functions, but not in membrane proteins (Aging n=68; Cell-Cycle n=533; Sign. transd. n=224; Rib. biog. n=406; Mem. transp. n=187), plotted as fraction of the datasets (%). (F) Protein abundance of SSB-bound and not SSB-bound proteins. (G) Many subunits of large oligomeric complexes are substrates of SSB. (H) Enrichment of protein-protein interactions among SSB substrates. *p ≤ 0.01; **p≤ 10−4; ***p ≤10−10, n.s. not significant. See also Figure S2.

