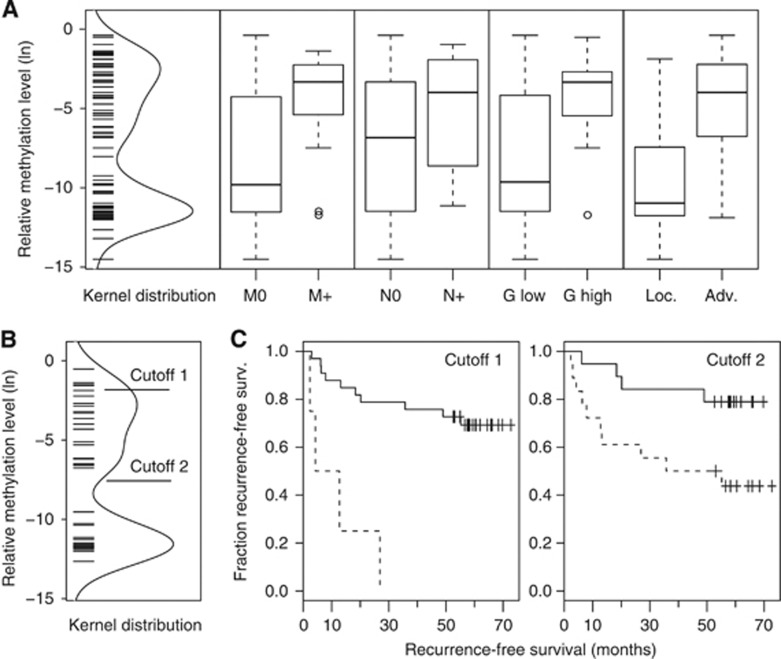
Figure 4.
(A) Distribution of methylation values detected in ccRCC and box plot analysis for subset-specific relative methylation levels of clinicopathological parameters; negative (M0) or positive (M+) for distant metastasis, negative (N0) or positive (N+) for lymph node metastasis, low (G<=2) or high (G>2) grade tumours and localised (pT⩾2, N0, M0 and G1+G1–2) or advanced (pT⩾3 and/or N+, M+ or G2–3 G3) disease. Bold horizontal lines show group medians; boxes and whiskers show the 25 and 75% and 10 and 90% quartiles, respectively. (B) Distribution of methylation values detected in the ccRCC survival subgroup and location of the statistical optimum (cutoff 1) or the limit of quantitative detection LQ (cutoff 2) cutoff values. (C) Kaplan–Meier plots showing relative survival of patients dichotomised by use of cutoff 1 or cutoff 2 values as indicated in (B). Note that some of the symbols displaying censored cases coincide due to similar follow-up periods of patients.

