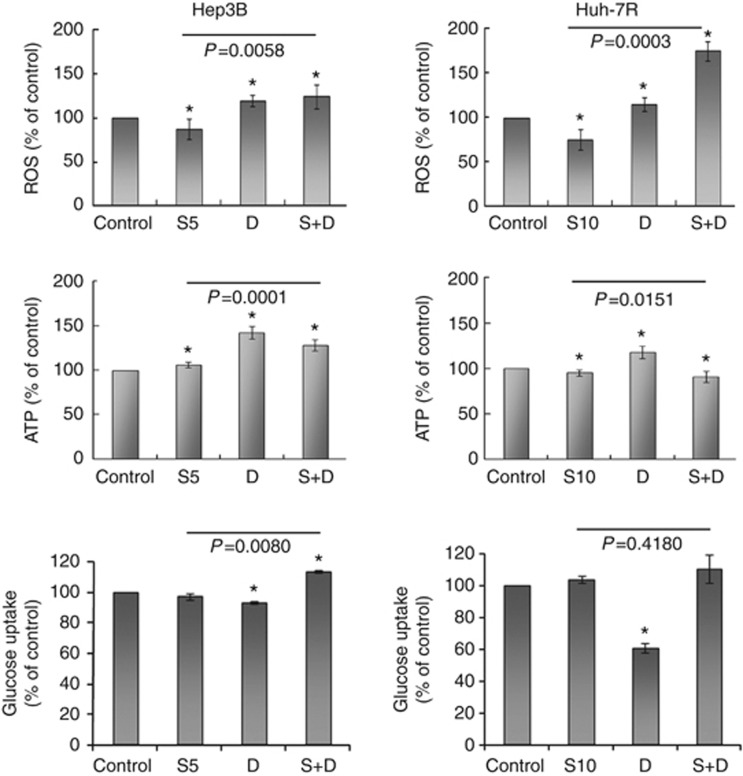
Figure 4.
Metabolic effects of treatment after 24-h exposure on intracellular levels of ROS (upper panel) and ATP (middle panel) and glucose uptake (lower panel) are shown. Columns represent mean values; while bars represent s.d. *Denotes P<0.05 compared with untreated control. S5, 5 μℳ sorafenib; S10, 10 μℳ sorafenib; D, 30 mℳ DCA; S+D, sorafenib combined with DCA.

