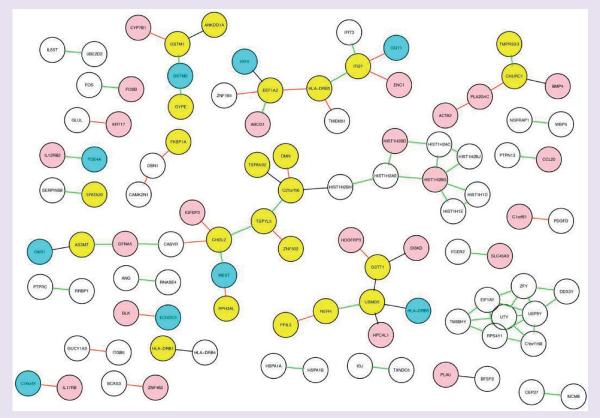
Figure 5. Integrative gene network of 86 common edges from the CAMP and HapMap consortium (GeneVar) cohorts.
From a subset of 608 genes, a subnetwork of 86 edges appeared in both CAMP and GeneVar networks using a threshold of posterior probability of 0.9. Hub nodes are indicated in pink for CAMP, cyan for GeneVar and yellow for both. The direction of the edges is shown by the edge color (green: both positive; black: both negative; red: opposite).
Reproduced with permission from [126] © 2009 BioMed Central.

