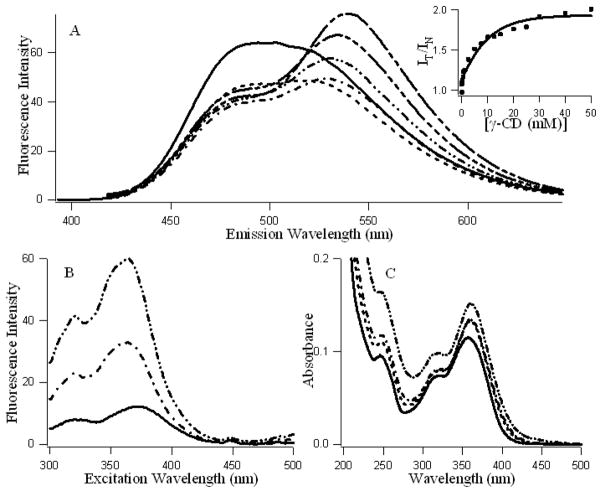
Figure 1.
A: Fluorescence emission spectra (λex = 380 nm), B: Fluorescence excitation spectra (λem = 530 nm) and C: Absorption spectra of fisetin (~ 7.5 μM) in presence of increasing concentrations of γ-cyclodextrin (0—, 1 ---, 5 –·–, 10 –··–, 20 –···–, 50 mM – – --). Ainset: Variation of the ratio of the intensity of tautomer vs normal isomers of fisetin (IT at 530 / IN at 470) with increasing [γ-cyclodextrin].

